Retrace
Retrace is an affordable SaaS APM tool designed specifically with developers in mind. It is designed to help developers optimize the performance of their applications in QA and “retrace” application problems in production via very detailed code level transactions traces. A free workstation level APM tool called Prefix helps developers as they write and test their code. Retrace is focused on being simple to use and affordable for developer teams of all sizes.
- Languages: .NET, .NET Core, Java
- SaaS based
- Integrated errors & log management
- Detailed code level transaction traces
- Optimized for developers
- Includes application metrics & server monitoring
- Very low overhead
- Easy to use and install
Cost: $25-50 per month per server, $10 for non-production
Monitoring Guide
Windows Performance Counters
Retrace can monitor any type of Windows Performance Counters.
There are three different ways to configure monitoring of Windows Performance Counters with Retrace.
1. Application Monitoring Template: .NET Framework Counters
These are monitors that can be configured within a specific application on the App tab. If you are tyring to monitor something specific to your .NET application, this is the preferred way.
Retrace makes it simple to select from dozens of standard counters. They are broken up by what they are related to. The .NET CLR, your app, IIS Site, or IIS Application Pool.
Many Windows Performance Counters use dynamic instance names that are based on the process ID, site name, or application pool name. Retrace automatically and dynamically always monitors the correct instance name.


2. Application Monitoring Template: Your Custom Counters
From the Performance Counters tab you can configure monitoring for virtually any Windows Performance Counter. This is most useful for monitoring your own custom counters related to your application.
If you want to monitor Windows Performance Counters for the .NET CLR, ASP.NET or IIS, this is not how you should do it. You should instead configure it as shown above from the App tab.
Besides monitoring your own custom counters, you could also use the application based configuration for a Windows Service like SQL Server, Exchange, etc. You could configure counters that you want to monitor across every server running that application.
3. Server Monitoring Template
Retrace supports configuring monitoring based on an application or via server templates. Server monitoring templates can be configured to monitor any Windows Performance Counter but they will not dynamically track application specific counters that have dynamic instance names as described above in #1.
You could use server monitoring templates to monitor a series of counters for something like SQL Server and then apply the server monitoring template to only your servers that run SQL Server. Another example would be monitoring how many active RDP sessions are connected to the server.
Key Transactions
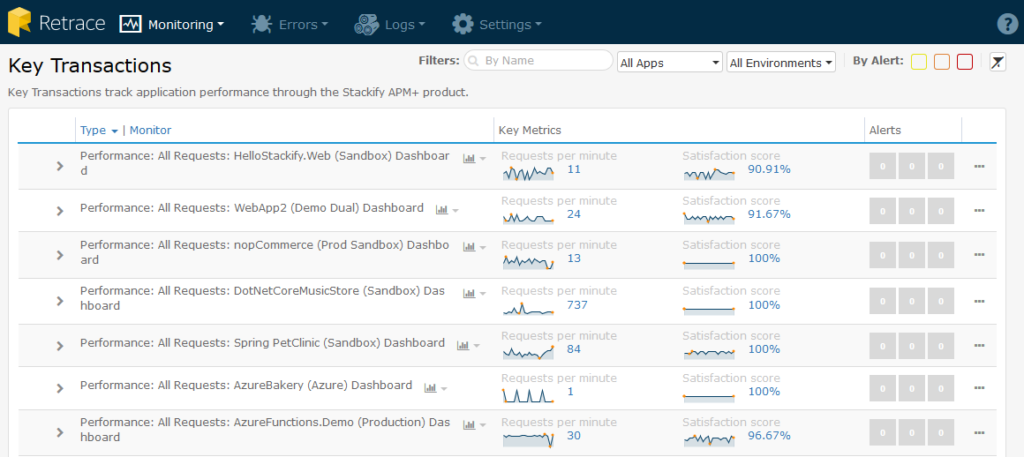
Key Transaction Monitors allow you to quickly identify critical transactions (Web Requests and SQL Queries) that APM has discovered and add a layer of intelligent, proactive monitoring & alerting around them. They’ll all appear together in a sortable, filterable list complete with inline spark lines and access to deeper levels of data & customization.
Monitoring Applications
Whenever a new application is added, Retrace will create a default Key Transaction to monitor some basic performance metrics of all requests to that app.


The default monitors are Average Load Time, Error %, Requests per Minute and Satisfaction Score.


