JMeter – Grafana – InfluxDB – Docker
This article provides the details of setting up Docker – Jmeter – Influx – Grafana Integration. Running Jmeter tests in command line mode provides a benefit of running the performance tests without consuming much system resources, also, provide the ability to scale the user load on any machine. However, one has to wait until the end of the test to view the results. InfluxDB and Grafana provide a feature to store and analyze time-series data respectively and could be used to real-time monitoring of the.
Installing InfluxDB and Grafana is a bit tedious task, but Blazemeter recently provided a white paper to install the InfluxDB and Grafana using Docker.
Blazemeter provides all the necessary setup files, which could be downloaded straight to your computer and can be used with Docker.
Installation of Docker
Download the Docker community edition from https://www.docker.com/community-edition and follow the installation instructions.
Open the PowerShell or command prompt and type “docker –version” to verify the successful installation of Docker. Given command returns the installed version details of Docker.
Installation of InfluxDB and Grafana using Docker
- Once you have Docker and Docker Compose successfully installed and up and running. Next step would be to download the Docker file created by Blazemeter using following link https://github.com/performancestack/dockergrafanainflux
- Place the downloaded unzipped files to a folder and then follow the following steps
- Open the console
- Navigate to “DockerGrafanaInfluxKit-master” folder
- Run the command: > docker-compose up
- If you see the following screen then the installation is successful

if you open http://localhost:3000 after the installation you should see your Grafana:

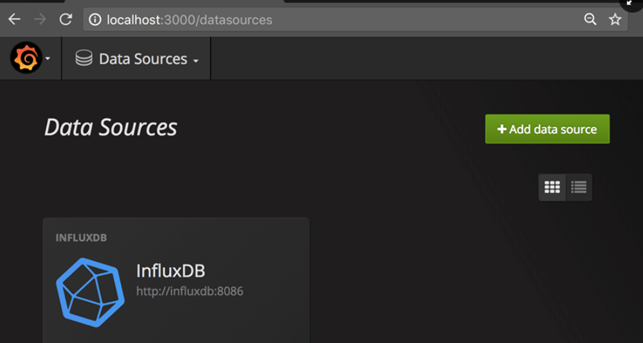
You can login using the default user ‘admin’ and ‘admin’ password. Also, if you go to the Grafana data sources configuration (Left top menu button -> Data Sources) you will see that the installed Grafana already has an inbuilt configuration with an InfluxDB instance that we are running in a separate docker container:
To be 100% sure that the integration works correctly, you can click on the ‘InfluxDB’ data source, scroll down to the end of the page and click on ‘Save and Test’. If you got ‘Data source is working’ which means your lightweight monitoring environment is ready and verified!
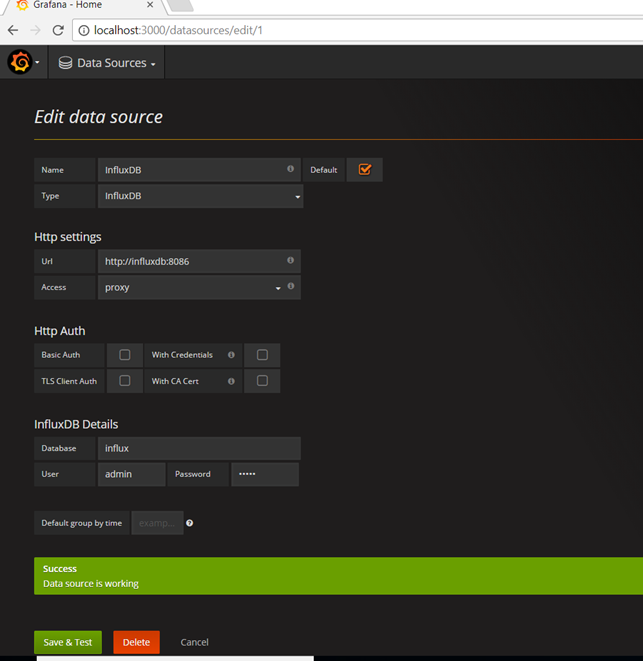
Following details will be required to set up the performance test monitoring using Jmeter ·
Host address: localhost or 127.0.0.1
Database port: 8086
Database name: influx
Database username: admin
Database password: admin
Setting up Jmeter
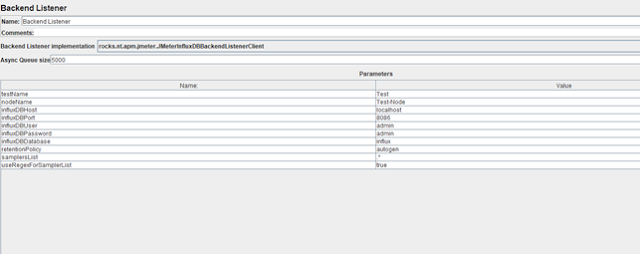
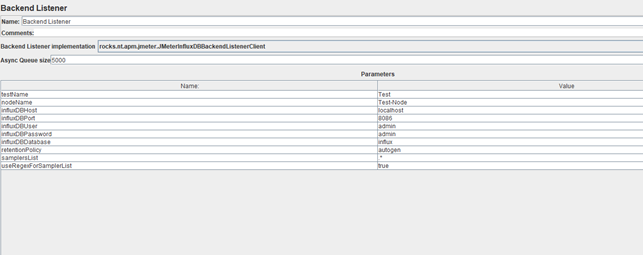
To setup the Jmeter to push the data to Influx DB you will require the Backend Listener in you test plan, however to use the Jmeter dashboard provided by Grafana you will require to include the “JMeter-InfluxDB-Writer 1.2” jar file into the /lib/ext directory of your JMeter installation. Jar file can be downloaded using following link. https://github.com/NovaTecConsulting/JMeter-InfluxDB-Writer/releases/tag/v-1.2 Restart your Jmeter and include the backend listener with the following values.
Setting up Jmeter Dashboard
Next step is to setup the Jmeter dashboard. Simplest way to do this is to use the Jmeter Dashboard and you can download this Grafana template in json format using link https://grafana.com/dashboards/1152
After that, open Grafana and instead of the new dashboard creation go to:
Menu -> Dashboards -> Import and choose “Download JSON”, specifying the data source that we have just created for that example:

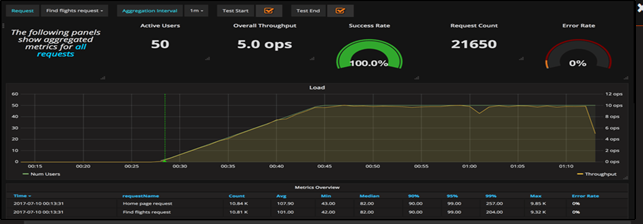
After that, by clicking on “Import” we will automatically create outstanding JMeter monitoring dashboard

Hope this article helps you in setting up the Docker – Jmeter – Influx – Grafana.