SAR (System Activity Reporter)
SAR (System Activity Reporter) Command in Unix Using sar you can monitor performance of various Linux subsystems (CPU, Memory, I/O..) in real time. Using sar, you can also collect all performance data on an on-going basis, store them, and do historical analysis to identify bottlenecks.
Sar (System Activity Reporter) is part of the sysstat package. This article explains how to install and configure sysstat package (which contains sar utility) and explains how to monitor the following Linux performance statistics using sar.
- Collective CPU usage
- Individual CPU statistics
- Memory used and available
- Swap space used and available
- Overall I/O activities of the system
- Individual device I/O activities
- Context switch statistics
- Run queue and load average data
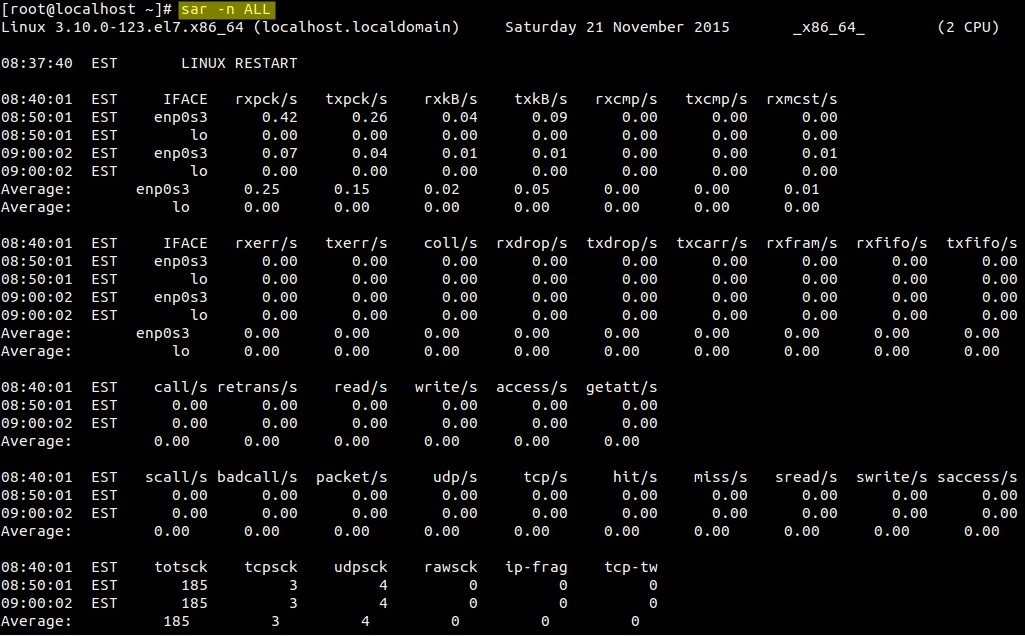
- Network statistics
- Report sar data from a specific time
This is the only guide you’ll need for sar utility. So, bookmark this for your future reference.
Install and Configure Sysstat
First, make sure the latest version of sar is available on your system. Install it using any one of the following methods depending on your distribution.
sudo apt-get install sysstat
(or)
yum install sysstat
(or)
rpm -ivh sysstat-10.0.0-1.i586.rpm
Install Sysstat from Source
wget http://pagesperso-orange.fr/sebastien.godard/sysstat-10.0.0.tar.bz2

tar xvfj sysstat-10.0.0.tar.bz2

cd sysstat-10.0.0

./configure --enable-install-cron
Note: Make sure to pass the option –enable-install-cron. This does the following automatically for you. If you don’t configure sysstat with this option, you have to do this ugly job yourself manually.
- Creates /etc/rc.d/init.d/sysstat
- Creates appropriate links from /etc/rc.d/rc*.d/ directories to /etc/rc.d/init.d/sysstat to start the sysstat automatically during Linux boot process.
- For example, /etc/rc.d/rc3.d/S01sysstat is linked automatically to /etc/rc.d/init.d/sysstat
After the ./configure, install it as shown below.
make

make install
Note: This will install sar and other systat utilities under /usr/local/binOnce installed, verify the sar version using “sar -V”. Version 10 is the current stable version of sysstat.
$ sar -V
sysstat version 10.0.0
(C) Sebastien Godard (sysstat  orange.fr)
Finally, make sure sar works. For example, the following gives the system CPU statistics 3 times (with 1 second interval).
$ sar 1 3
Linux 2.6.18-194.el5PAE (dev-db)        03/26/2011      _i686_  (8 CPU)

01:27:32 PM       CPU     %user     %nice   %system   %iowait    %steal     %idle
01:27:33 PM       all      0.00      0.00      0.00      0.00      0.00    100.00
01:27:34 PM       all      0.25      0.00      0.25      0.00      0.00     99.50
01:27:35 PM       all      0.75      0.00      0.25      0.00      0.00     99.00
Average:          all      0.33      0.00      0.17      0.00      0.00     99.50
Utilities part of Sysstat for SAR (System Activity Reporter)
Following are the other sysstat utilities.
- sar collects and displays ALL system activities statistics.
- sadc stands for “system activity data collector”. This is the sar backend tool that does the data collection.
- sa1 stores system activities in binary data file. sa1 depends on sadc for this purpose. sa1 runs from cron.
- sa2 creates daily summary of the collected statistics. sa2 runs from cron.
- sadf can generate sar report in CSV, XML, and various other formats. Use this to integrate sar data with other tools.
- iostat generates CPU, I/O statistics
- mpstat displays CPU statistics.
- pidstat reports statistics based on the process id (PID)
- nfsiostat displays NFS I/O statistics.
- cifsiostat generates CIFS statistics.
Collect the statistics using cron job – sa1 and sa2
Create sysstat file under /etc/cron.d directory that will collect the historical sar data.
# vi /etc/cron.d/sysstat
*/10 * * * * root /usr/local/lib/sa/sa1 1 1
53 23 * * * root /usr/local/lib/sa/sa2 -A
If you’ve installed sysstat from source, the default location of sa1 and sa2 is /usr/local/lib/sa. If you’ve installed using your distribution update method (for example: yum, up2date, or apt-get), this might be /usr/lib/sa/sa1 and /usr/lib/sa/sa2.
/usr/local/lib/sa/sa1
- This runs every 10 minutes and collects sar data for historical reference.
- If you want to collect sar statistics every 5 minutes, change */10 to */5 in the above /etc/cron.d/sysstat file.
- This writes the data to /var/log/sa/saXX file. XX is the day of the month. saXX file is a binary file. You cannot view its content by opening it in a text editor.
- For example, If today is 26th day of the month, sa1 writes the sar data to /var/log/sa/sa26
- You can pass two parameters to sa1: interval (in seconds) and count.
- In the above crontab example: sa1 1 1 means that sa1 collects sar data 1 time with 1 second interval (for every 10 mins).
/usr/local/lib/sa/sa2
- This runs close to midnight (at 23:53) to create the daily summary report of the sar data.
- sa2 creates /var/log/sa/sarXX file (Note that this is different than saXX file that is created by sa1). This sarXX file created by sa2 is an ascii file that you can view it in a text editor.
- This will also remove saXX files that are older than a week. So, write a quick shell script that runs every week to copy the /var/log/sa/* files to some other directory to do historical sar data analysis.