Dynatrace – RUM
Dynatrace – RUM (Real User Monitoring)
Scenario 2: Analysis based on browser type
Sometimes you need to figure out if users that share the same browser type are facing the same performance issues.
To access multidimensional analysis based on browser type
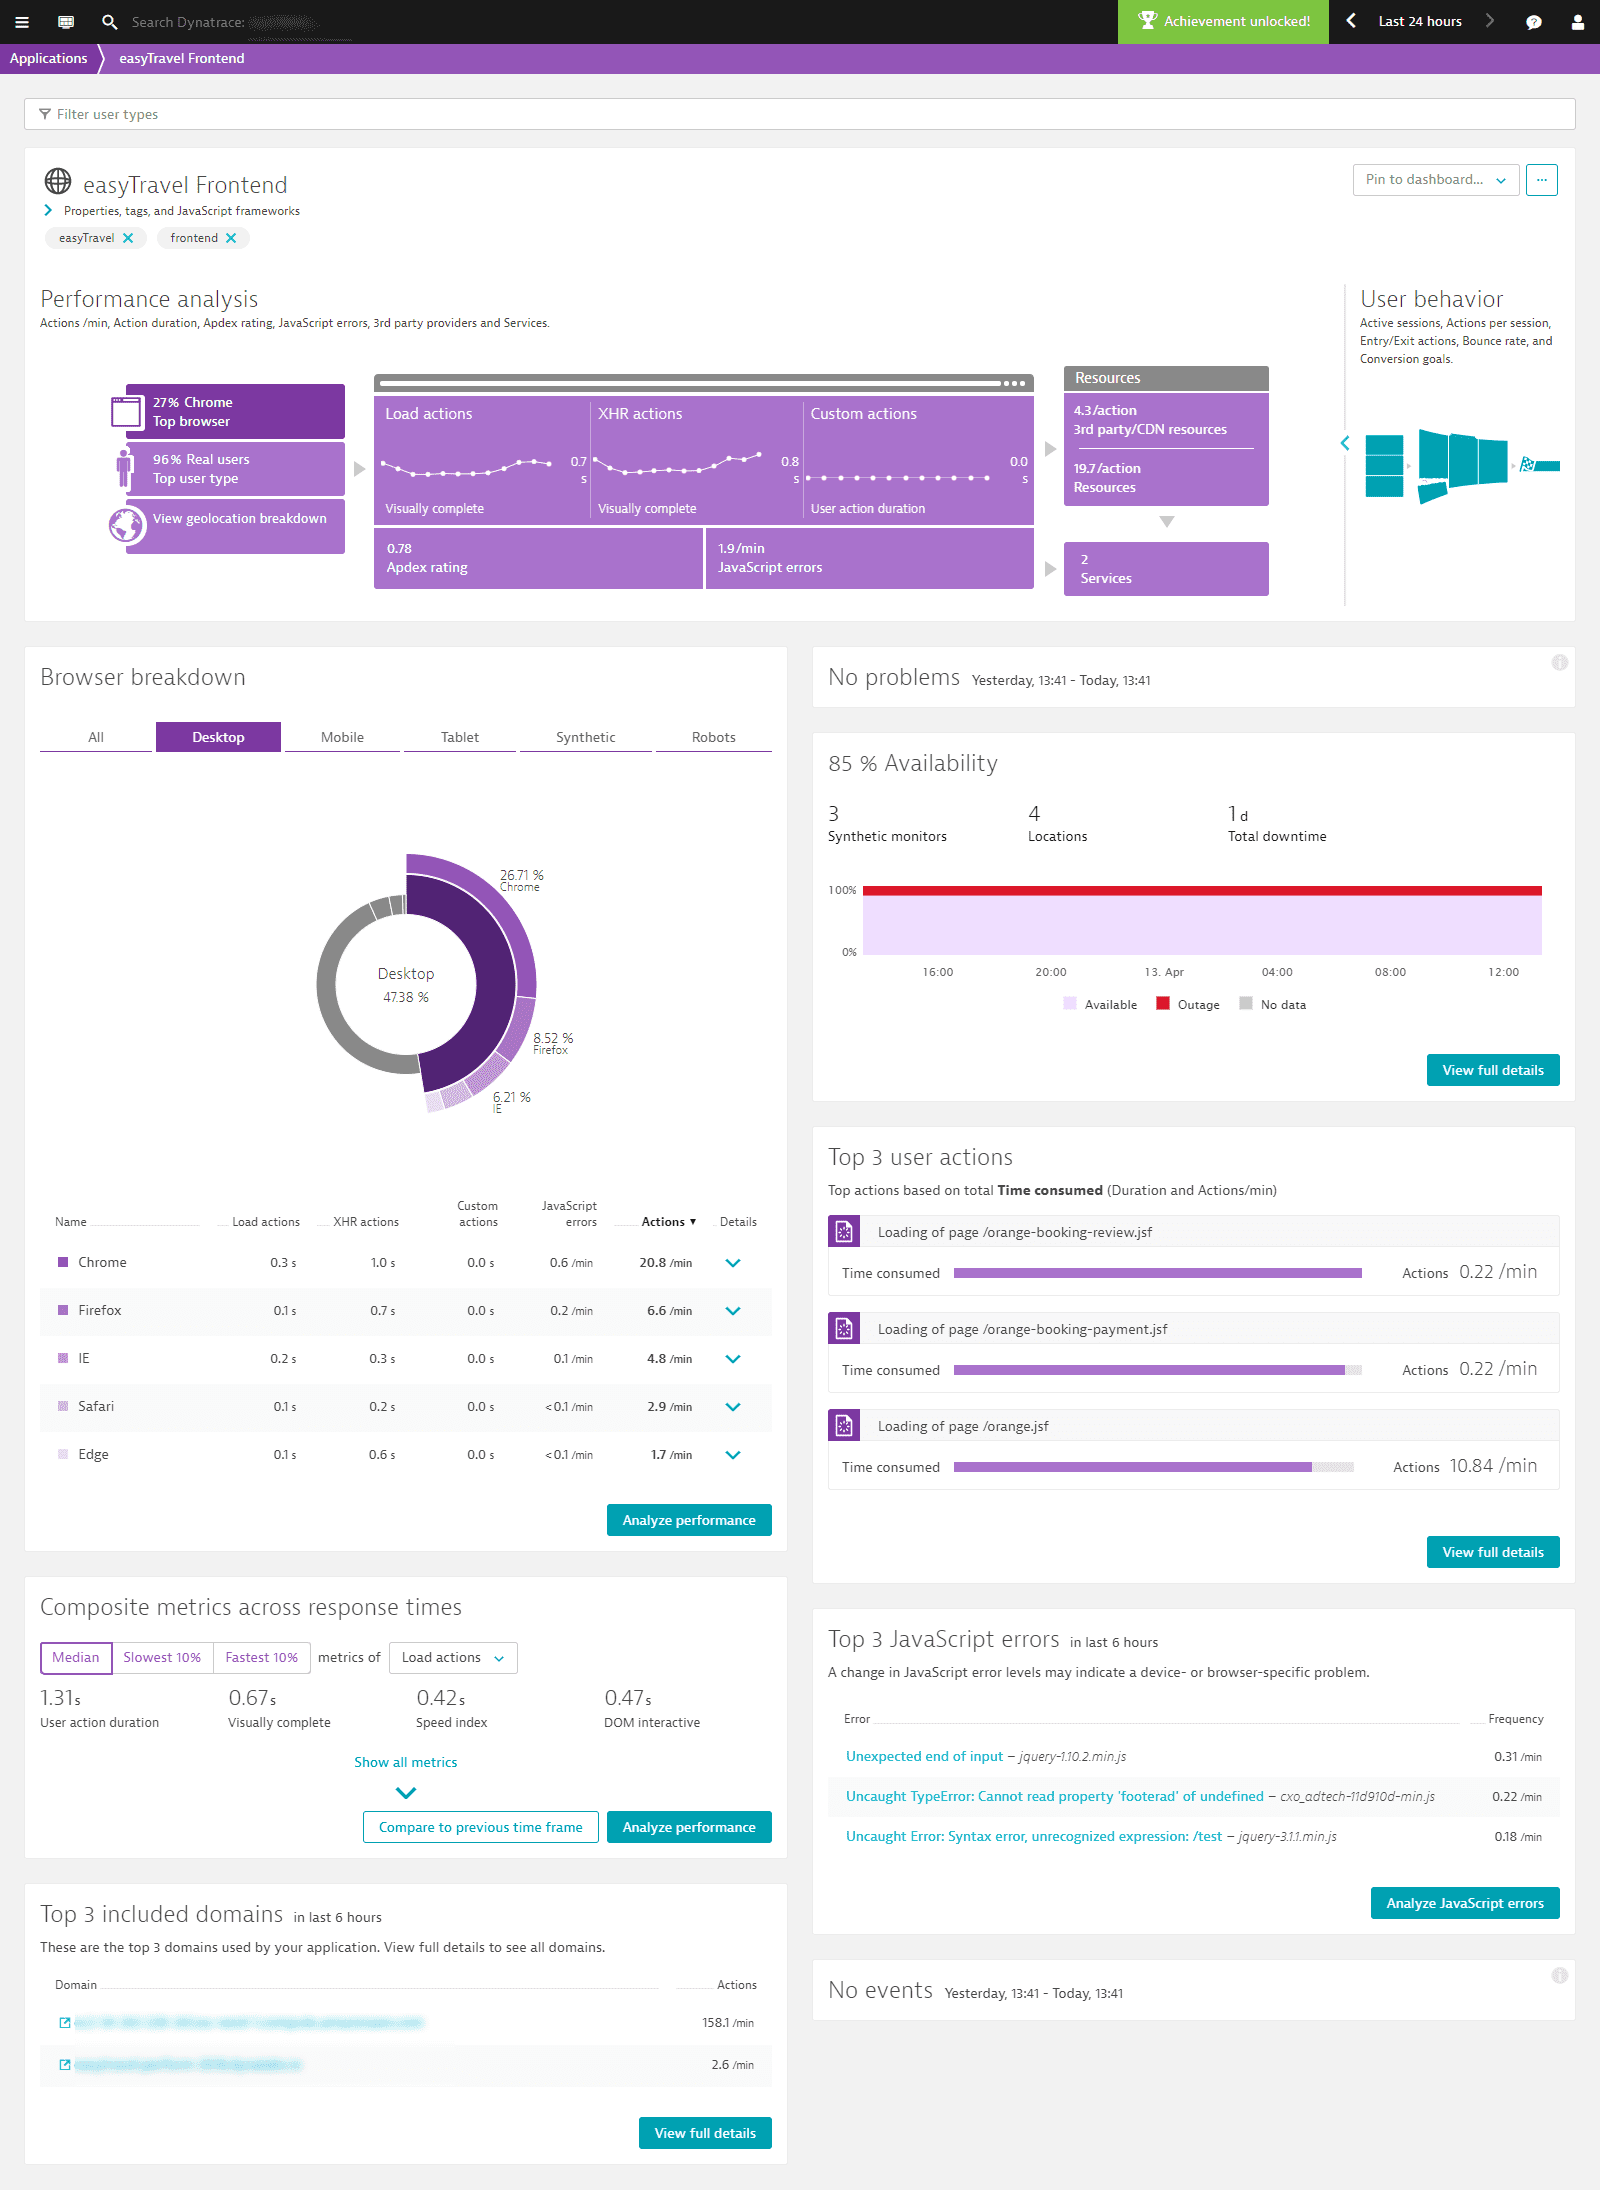
- Select Applications from the navigation menu.
- Select the application you want to analyze.
- Within the Performance analysis infographic, click the Top browser tile in the upper-left corner to display the Browser breakdown section.
- Click the Analyze performance button at the bottom of the section.


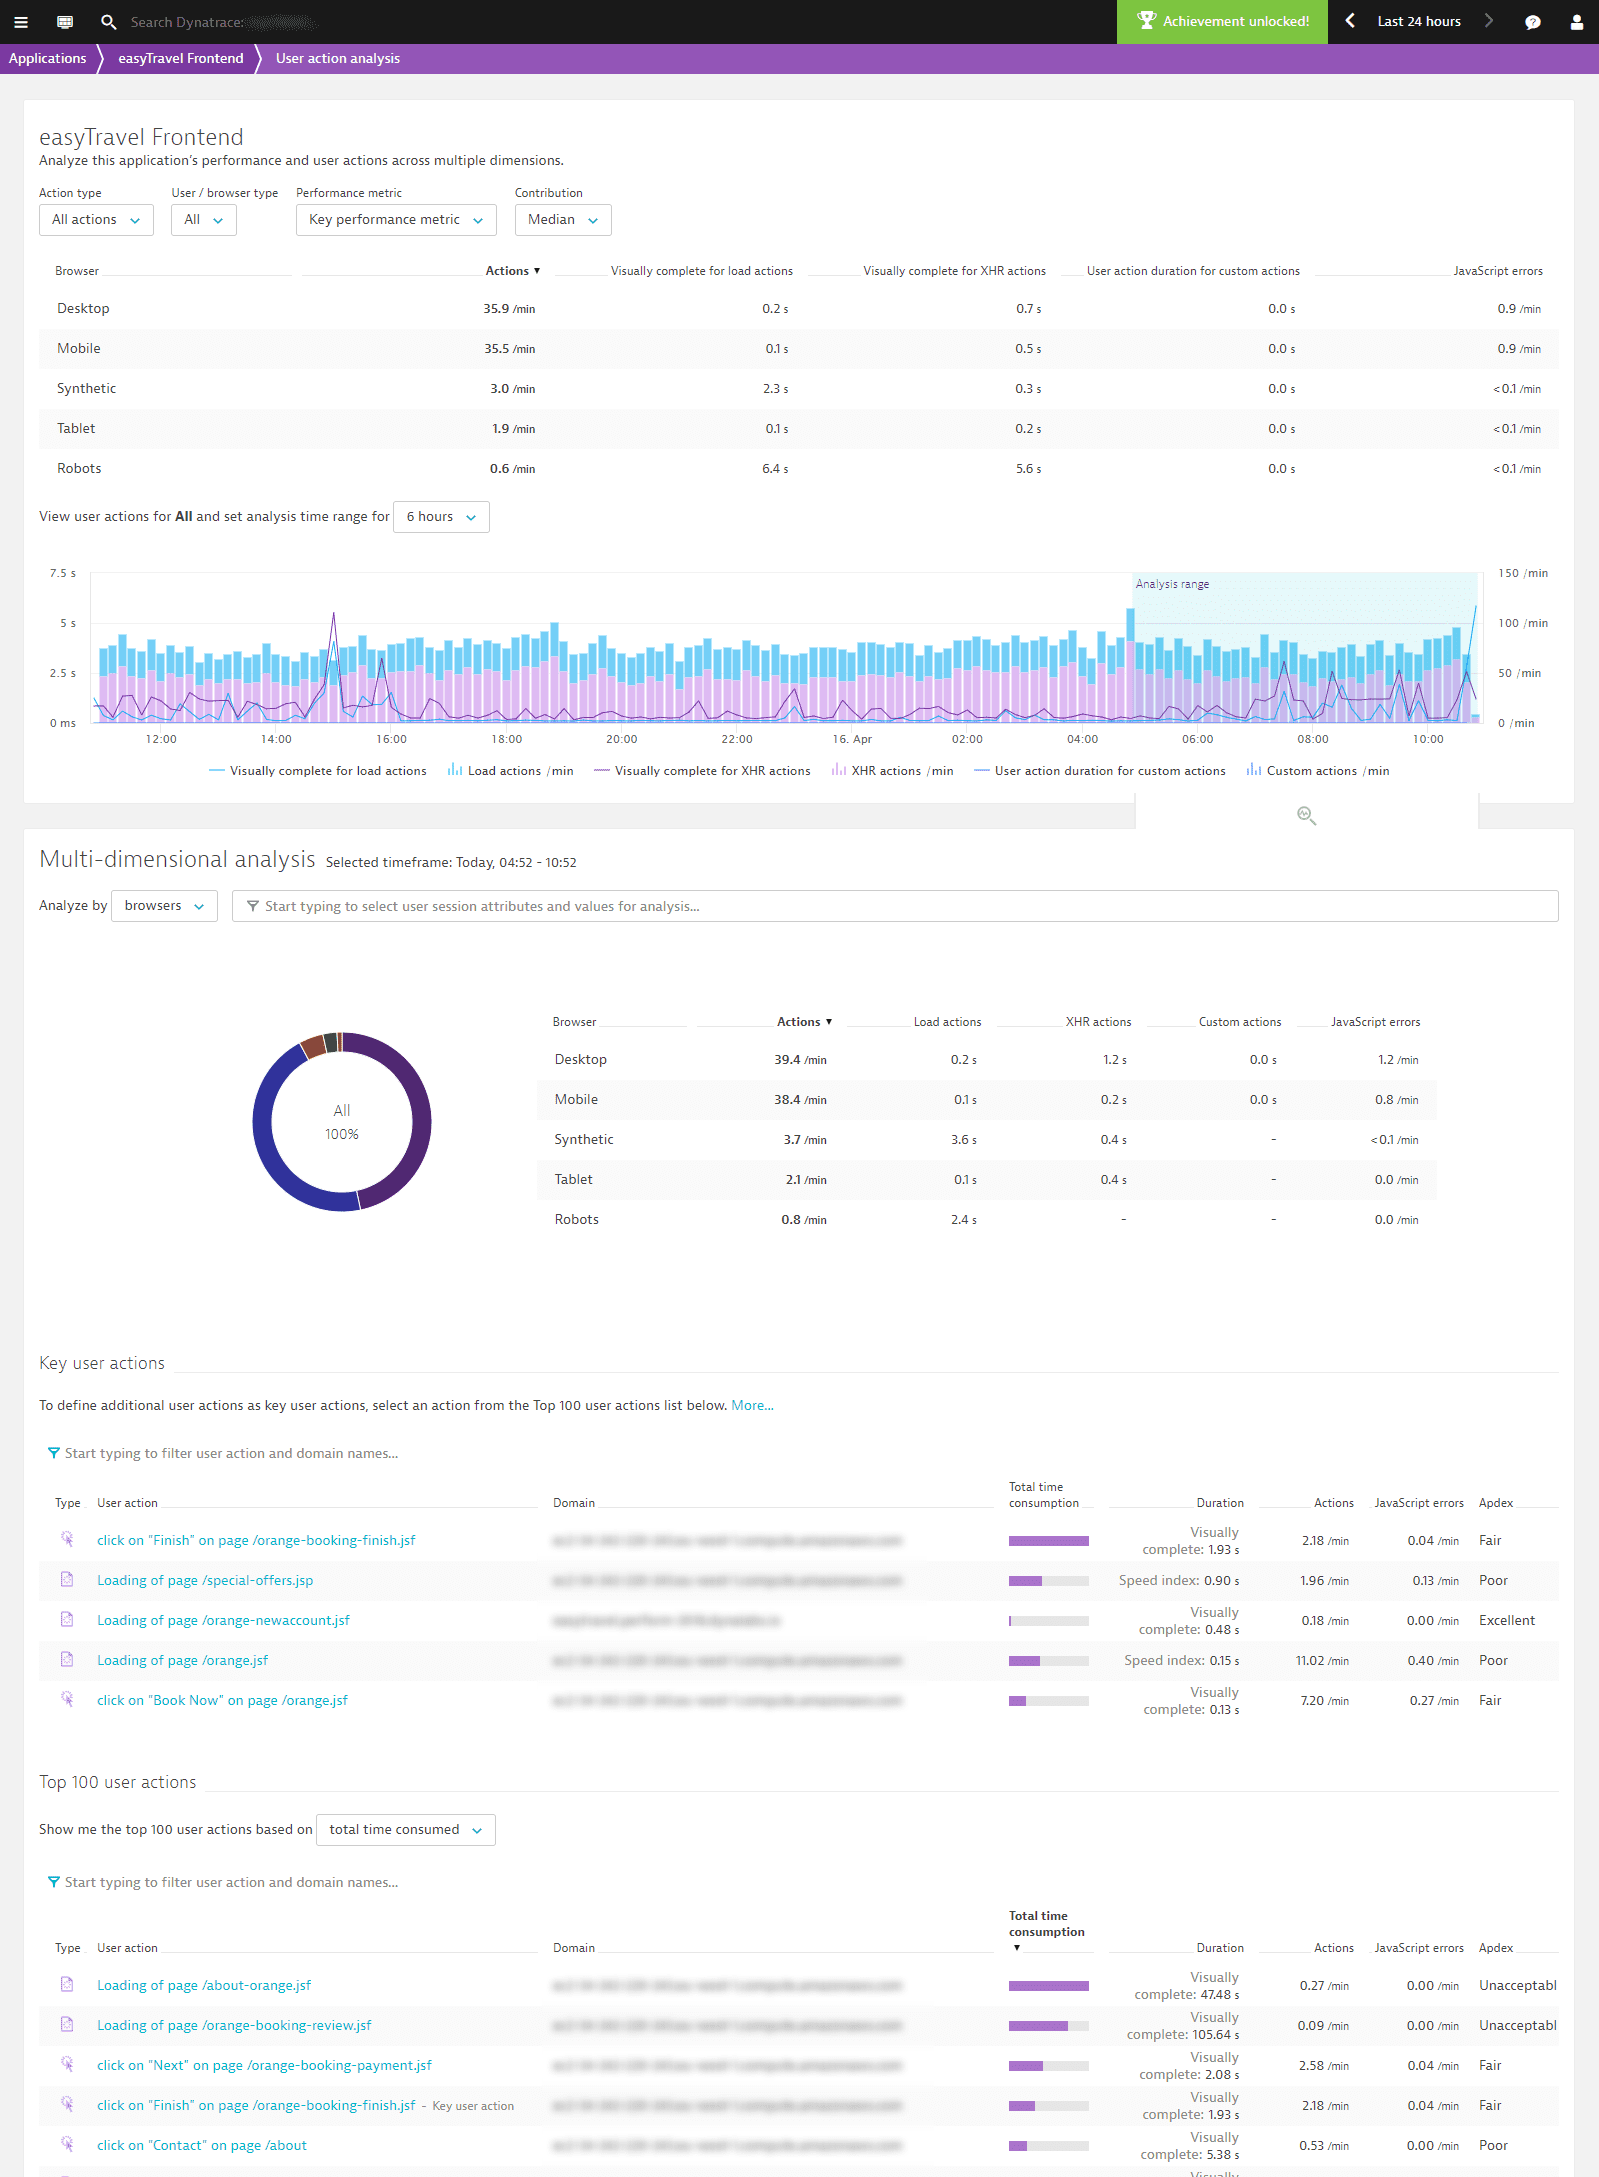
 This takes you to the Multidimensional analysis view, where the analysis mode is set to Browsers (see below).
 - From the filter droplists at the top of the page, in Dynatrace – RUM, select relevant values for filtering based on Action type, User / browser type, Performance metric, and Contribution.


- Select a duration from the analysis time range drop list.
- Click in the timeline chart to select the timeframe you want to analyze. From here, you can pinpoint and analyze only those user actions you they relevant to your analysis.
Scenario 3: Analysis based on user type
Sometimes you want to learn more about the bots that crawl your website, perhaps because your company is working toward Search Engine Optimization (SEO), or you just want to see a “clean room request” made via Synthetic monitoring.
To access multidimensional analysis based on user type
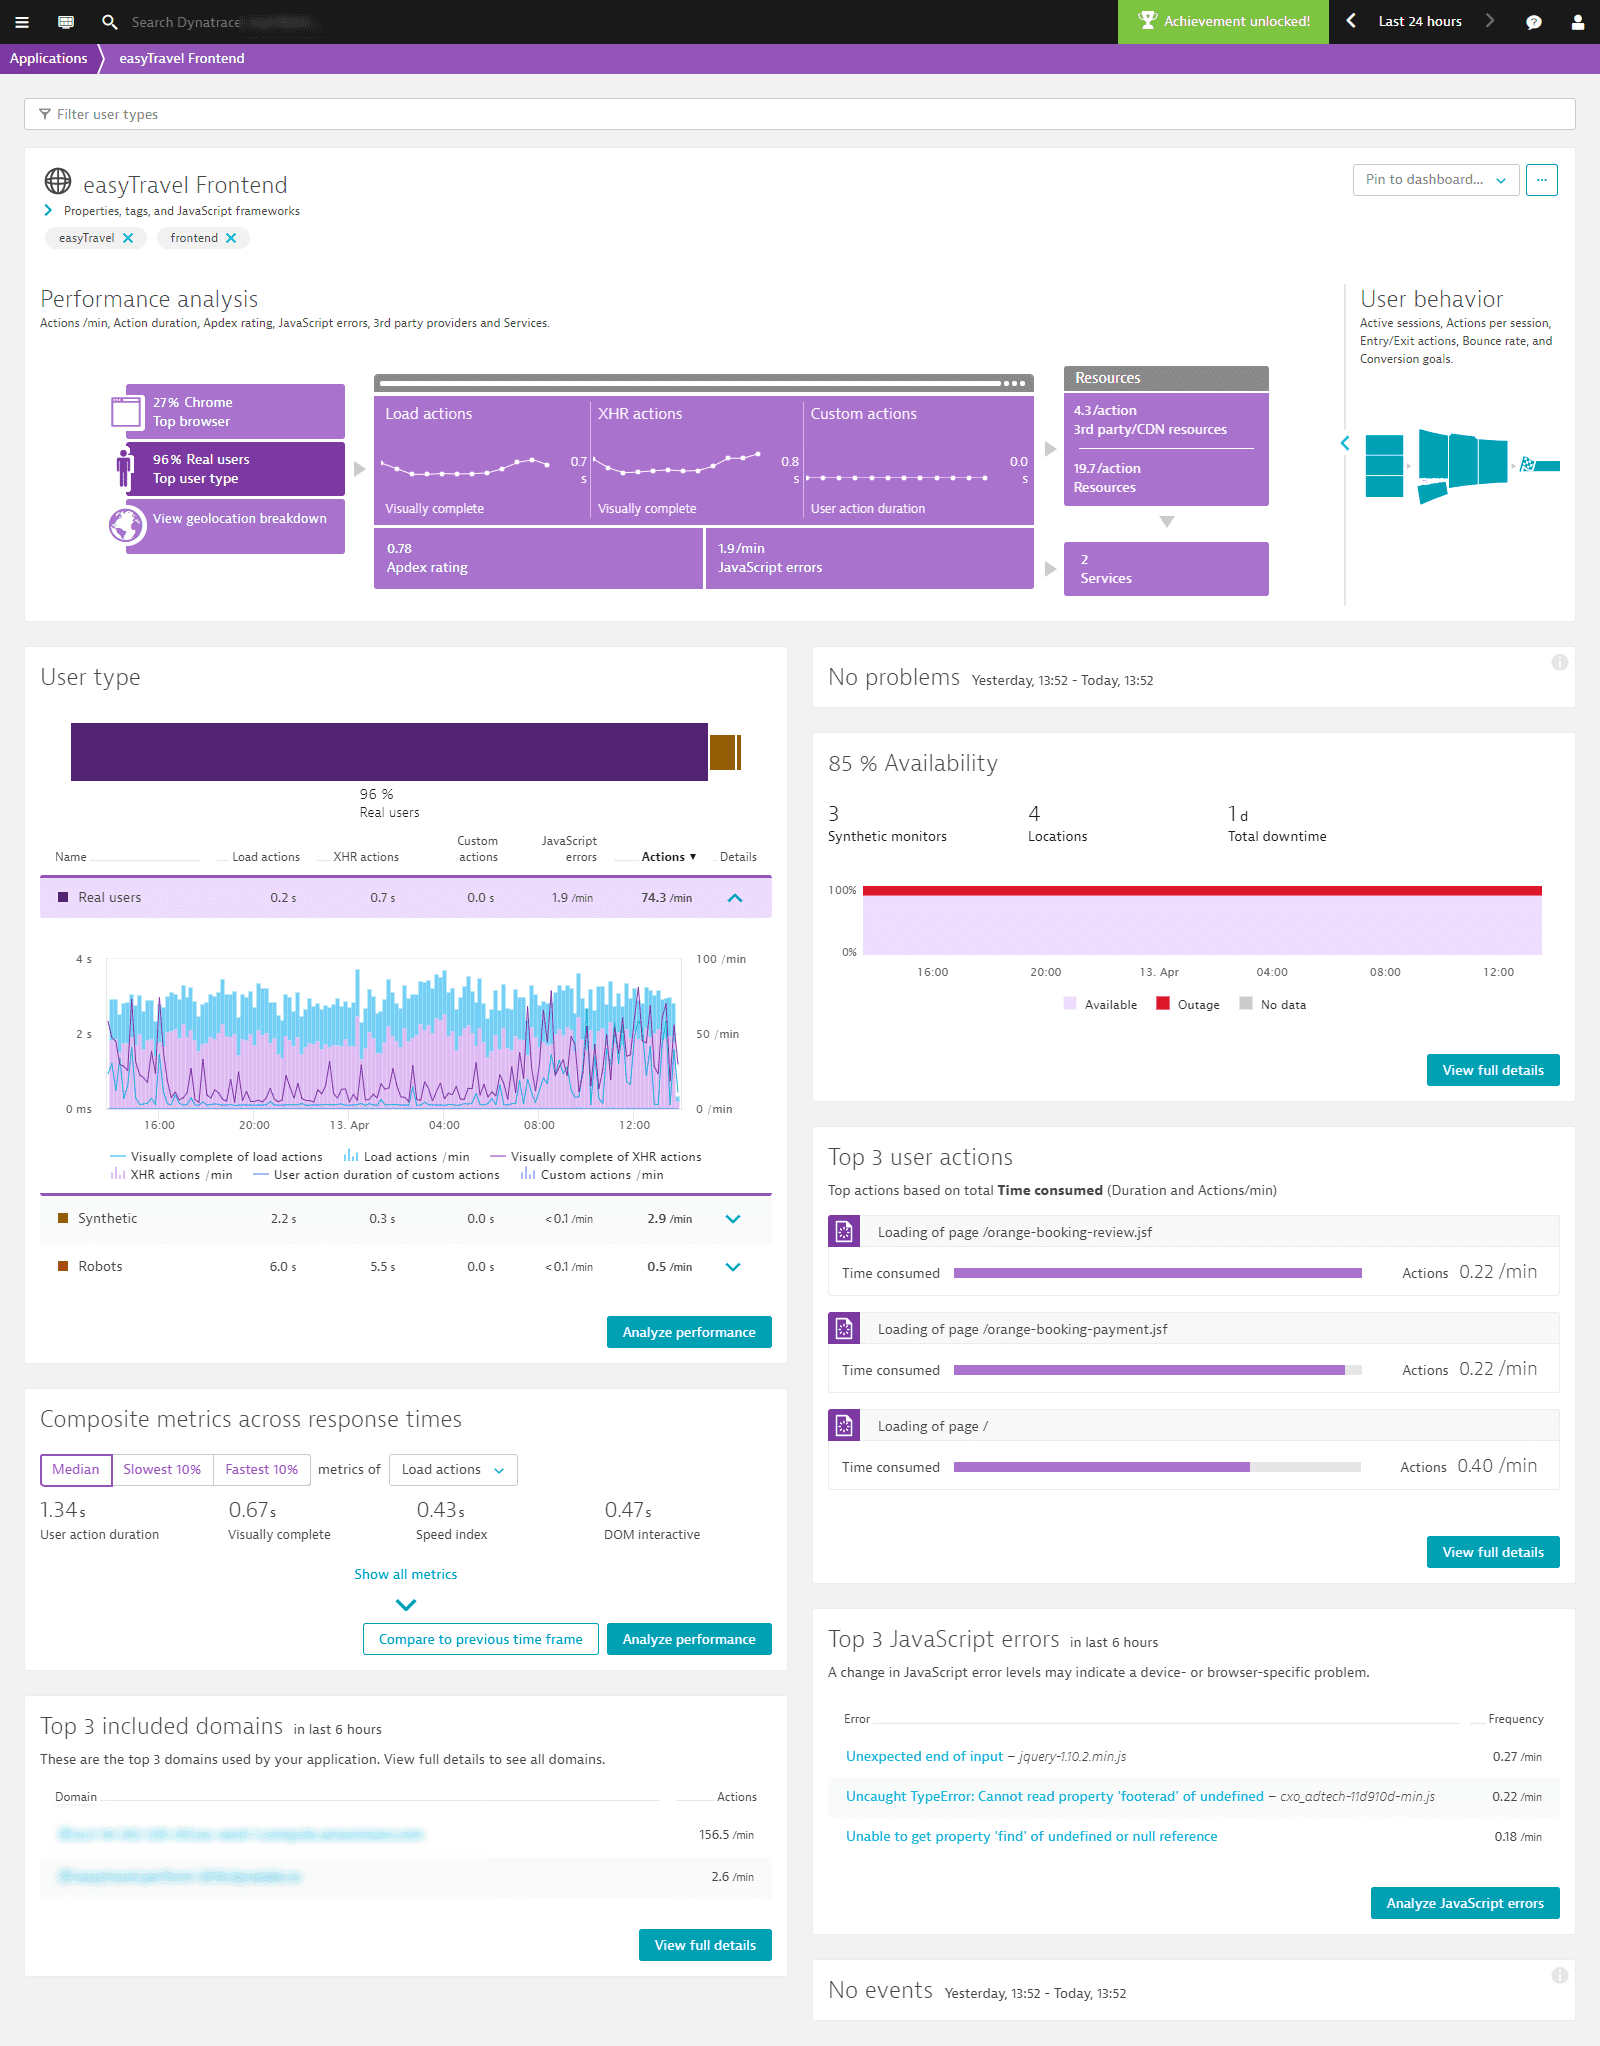
- Select Applications from the navigation menu.
- Select the application you want to analyze.
- Within the Performance analysis infographic, click the Top user type tile in the upper-left corner to display the User type section.
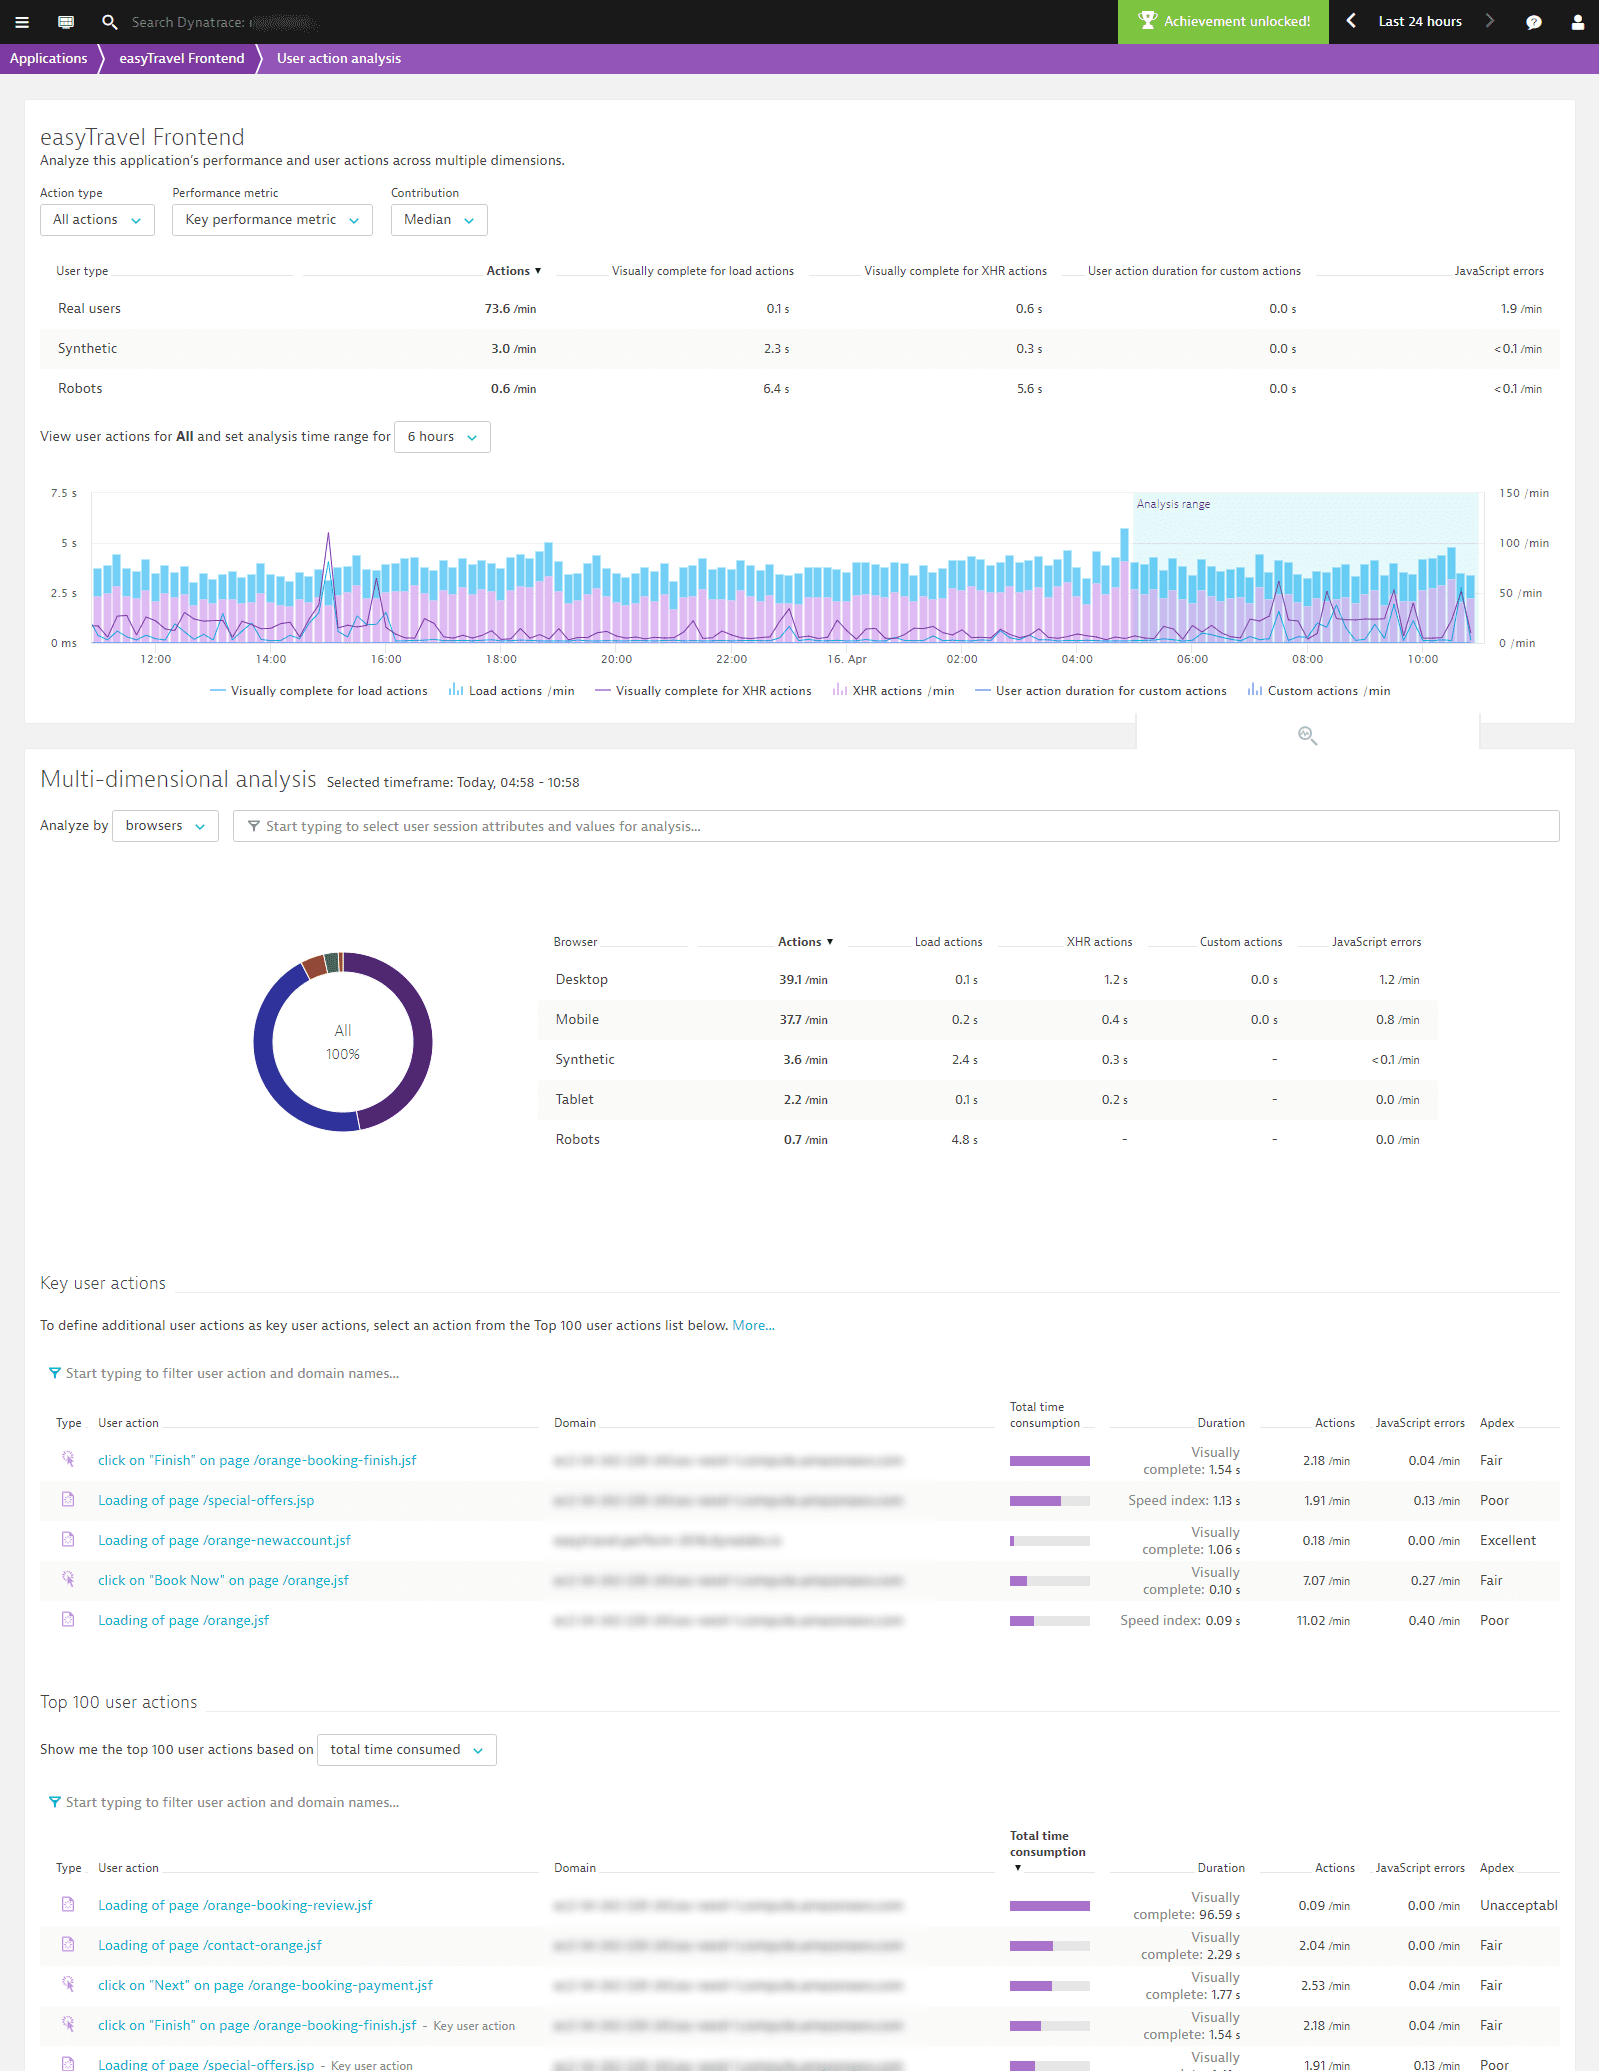
- Click the Analyze performance button at the bottom of the section.This takes you to multi-dimensional User action analysis view , in Dynatrace – RUM, which highlights the different user types that have performed the user actions under analysis. The Analyze by droplist in the Multidimensional analysis section is preset to Browsers.
- From the filter droplists at the top of the page, select relevant values for filtering based on Action type, Performance metric, and Contribution.
- Select a duration from the analysis timeframe range drop list.
- Click in the timeline chart to select the timeframe you want to analyze. From here, you can pinpoint and analyze only those user actions that you’re most interested in.
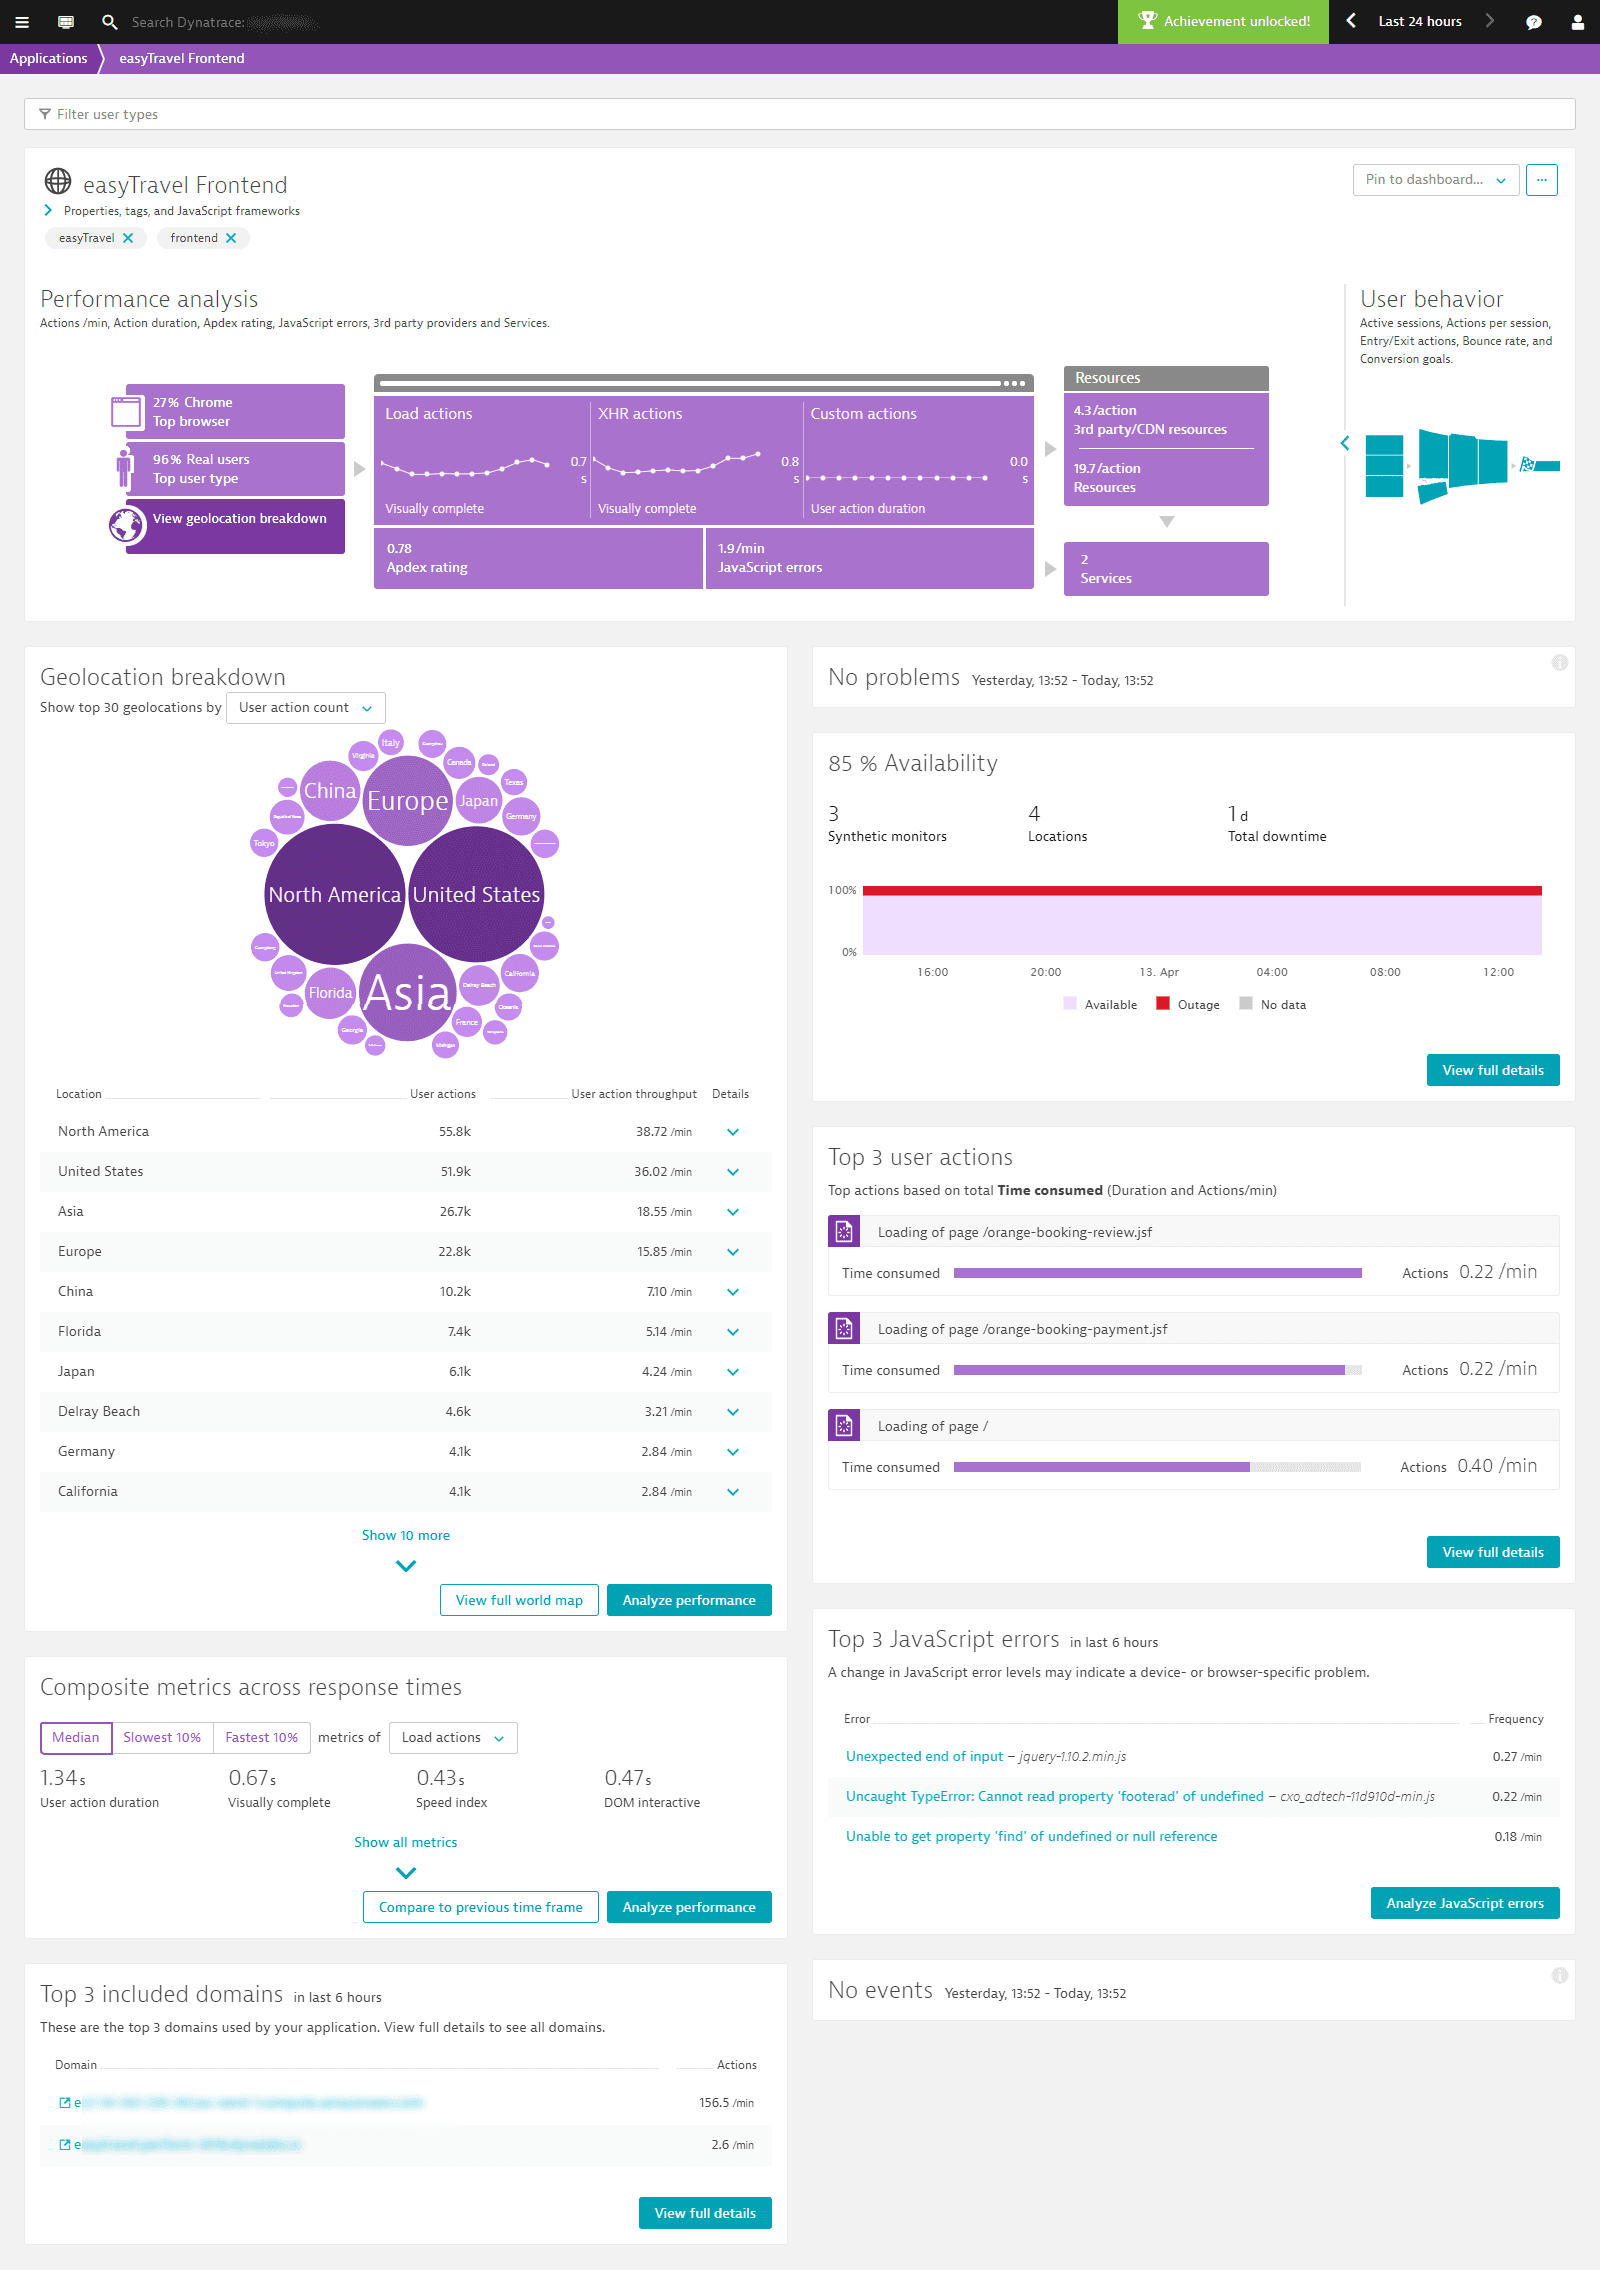
Scenario 4: Analysis based on geolocation
In this scenario, the focus is on finding user actions from a specific geographic region. Let’s say you’ve added a Content Delivery Network (CDN) for a certain region and want insights into how well the new CDN is working.
To access multidimensional analysis based on geolocation
- Select Applications from the navigation menu.
- Select the application you want to analyze.
- Within the Performance analysis infographic, click the View geolocation breakdown tile in the lower-left corner to display the Geolocation breakdown section.
- Click the Analyze performance button at the bottom of the section.This takes you to multidimensional User action analysis view , in Dynatrace – RUM, which now shows the top geolocations where your user actions originate from.
- From the filter droplists at the top of the page, select relevant values for filtering based on Action type, User type, Performance metric, and Contribution.
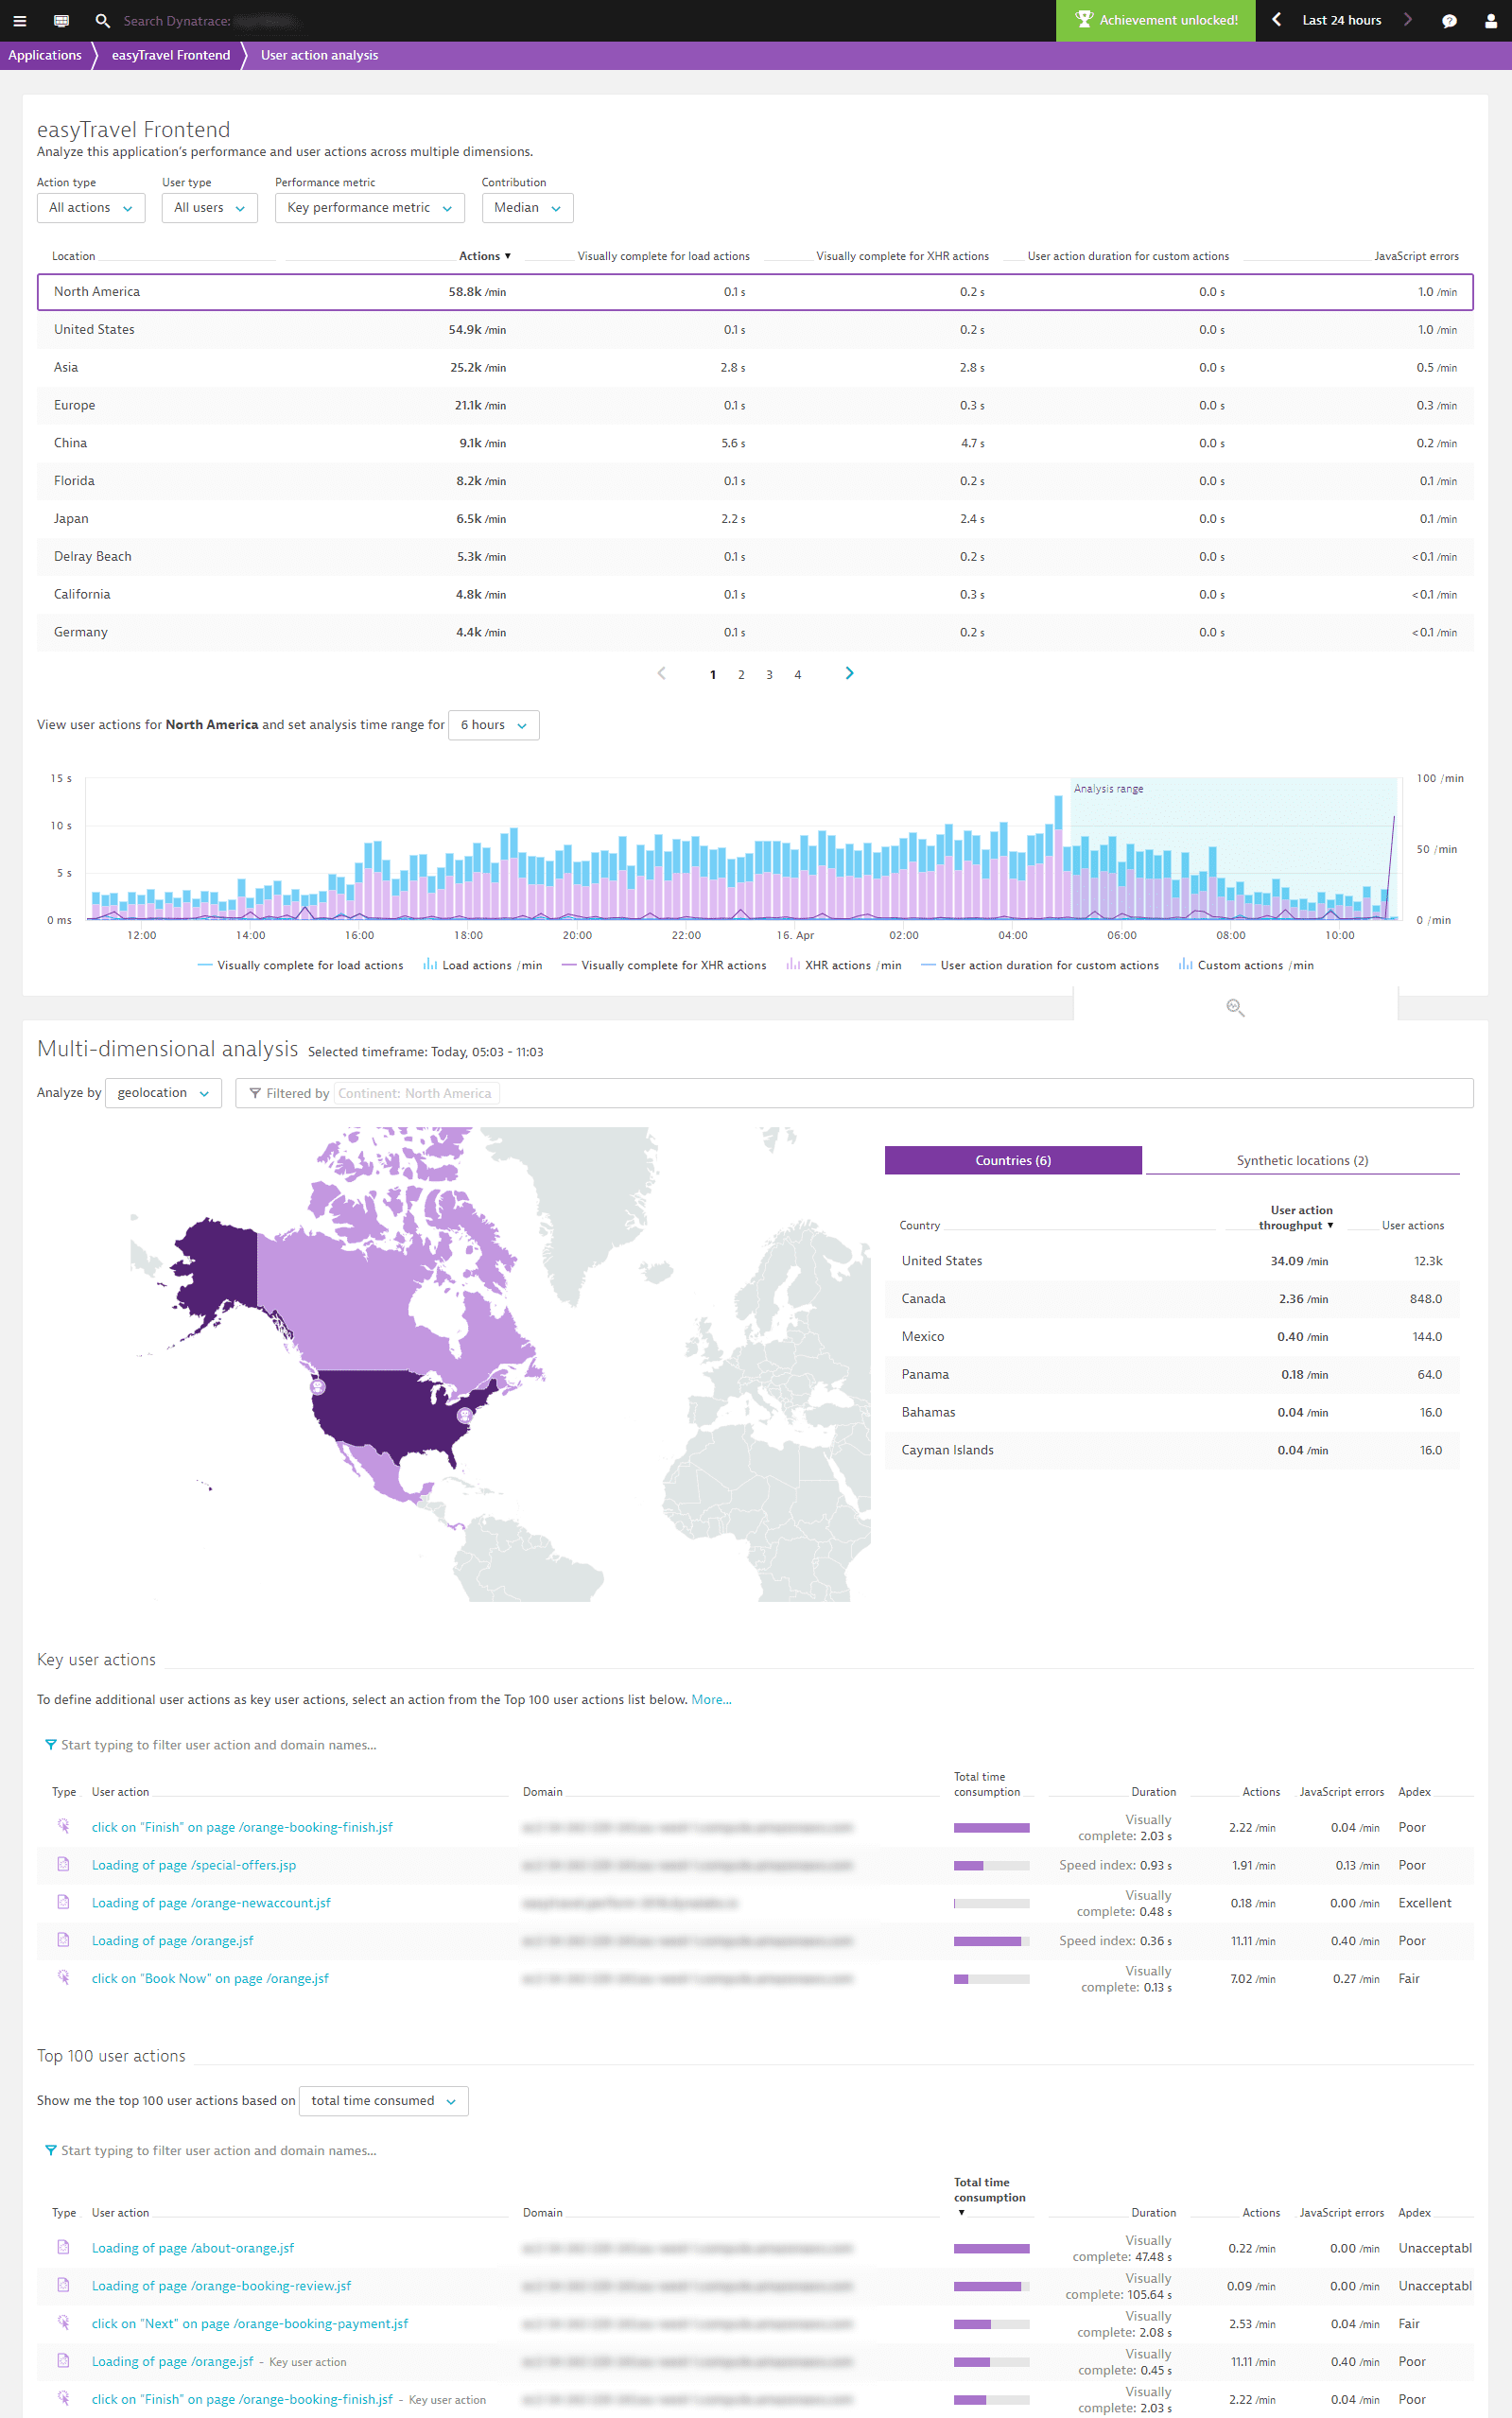
- Select a duration from the analysis time range drop list.
- Click in the timeline chart to select the timeframe you want to analyze. From here, you can pinpoint and analyze only those user actions that are relevant to your analysis.