Dynatrace – RUM
Dynatrace – RUM (Real User Monitoring) enables you to dig deep into your user actions and perform analysis across numerous dimensions. Multidimensional User action analysis pages can be accessed from many entry points throughout Dynatrace. Depending on where you begin your analysis, pre-selected filters can be applied and carried forward as your analysis progresses.
Performance analysis
The Performance analysis section displays a number of performance metrics for your application. To view the sections pertaining to performance analysis, expand the Performance analysis part of the infographic.


User behavior
The User behavior section, in Dynatrace – RUM, displays a number of user behavior metrics for your application. To view the sections related to user behavior, expand the User behavior part of the infographic.
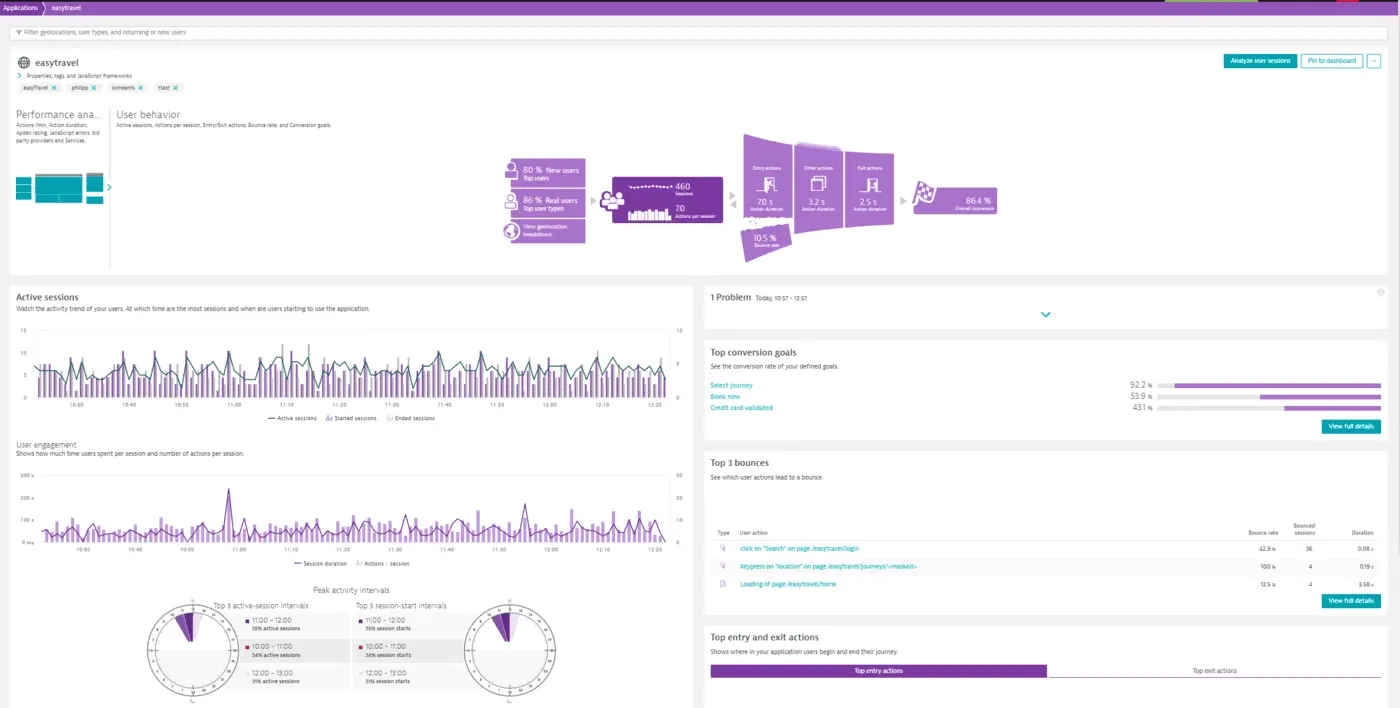


User behavior analysis
The User behavior analysis section displays a number of key performance metrics regarding user behavior, like bounces, top landing and exit pages, conversions and many more. Just expand the User behavior analysis section of the infographic on the application overview page to view the user behavior analysis options.


Multidimensional analysis – Dynatrace – RUM
Dynatrace – RUM (Real User Monitoring) enables you to dig deep into your user actions and perform analysis across numerous dimensions. Multidimensional User action analysis pages can be accessed from many entry points throughout Dynatrace. Depending on where you begin your analysis, pre-selected filters can be applied and carried forward as your analysis progresses.
Following are the main entry scenarios for making use of the latest multidimensional
User action analysis views.
Scenario 1: Analysis based on user action type
Dynatrace differentiates between Load actions, XHR actions, and Custom actions (see below), enabling you to apply the ideal performance metrics for each action type. This provides for focused, in-context analysis of each user action type.
To access multidimensional analysis based on user action type
- Select Applications from the navigation menu.
- Select the application you want to analyze.
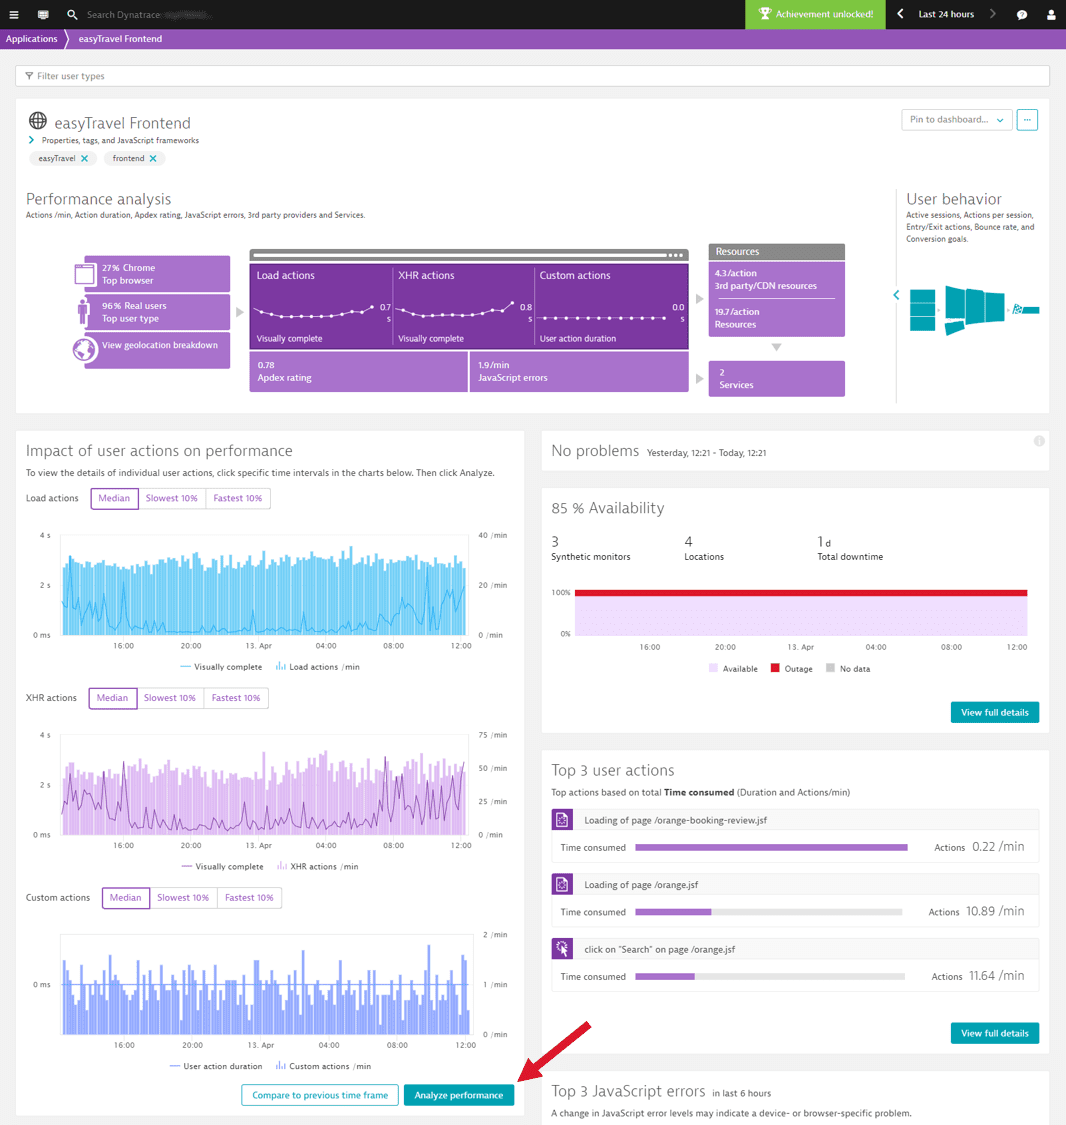
- In the Impact of user actions on performance section of the page, click the Analyze Performance button to open the User action analysis view.


 The upper section of the multidimensional User action analysis page provides primary filtering options you can use to focus analysis on specific user action types.
 - From the filter droplists at the top of the page, select relevant values for filtering based on Action type, User type, Performance metric, and Contribution (see image below).
- Select a duration for the analysis timeframe from the Analyze user actions during the past… drop list.
- Click in the timeline chart to select the timeframe you want to analyze. The lower section of the view shows the more detailed, multi-dimensional user action analytics view with all the primary filters applied.
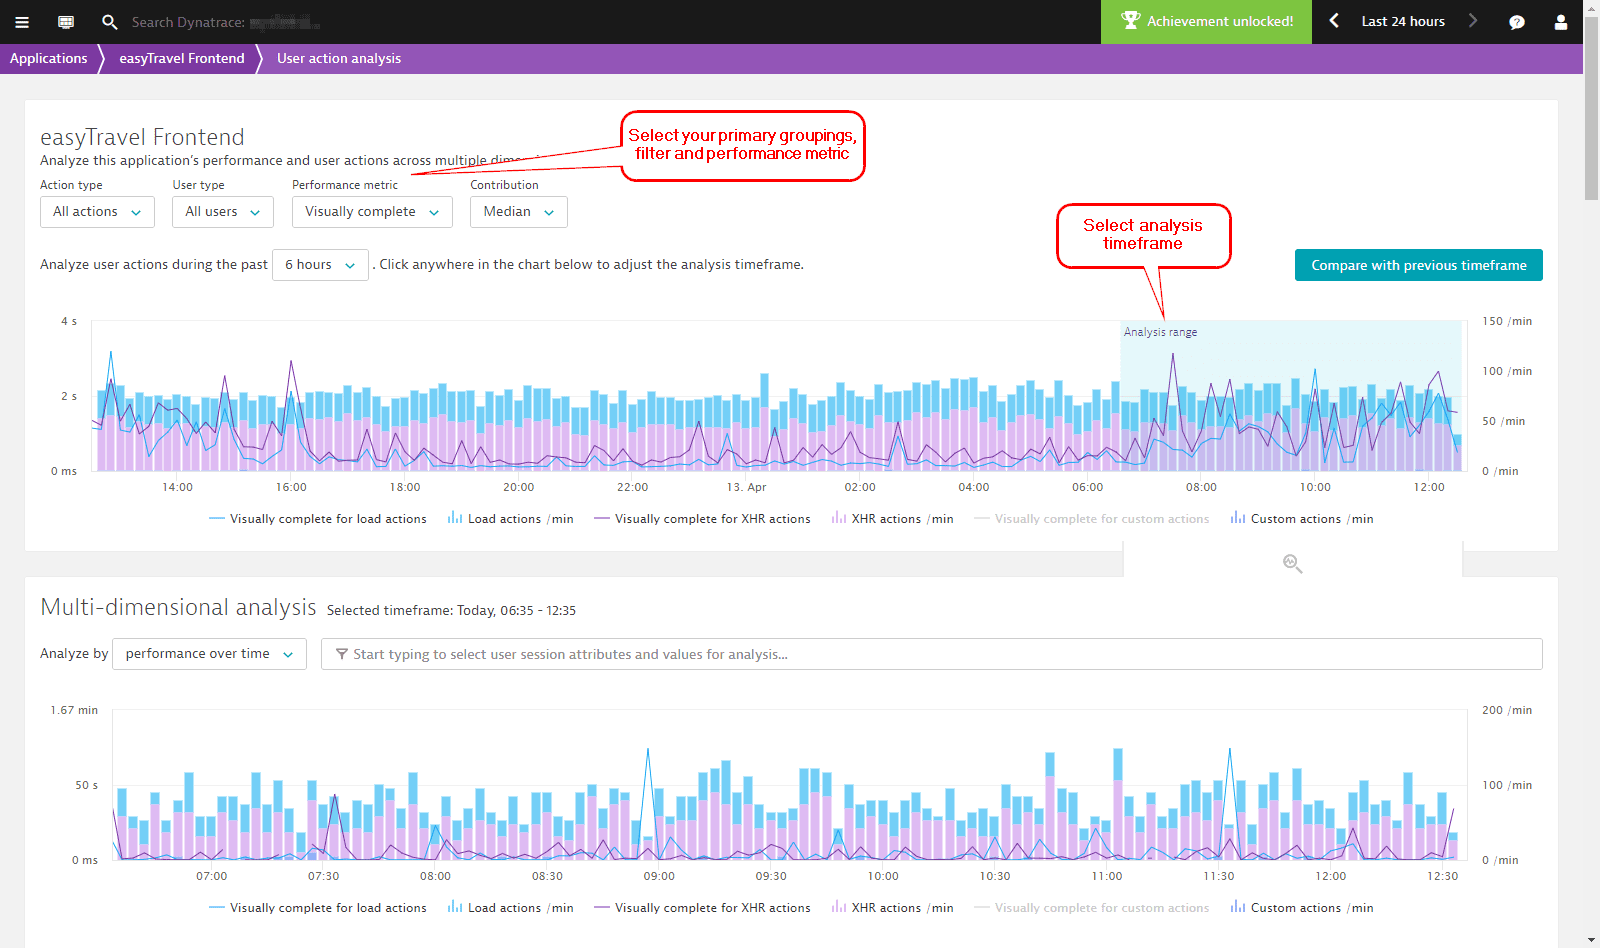


- Optionally click in the Filtered by field to add additional filters. Filters are available for action duration, Apdex, JavaScript errors, user type, browser, location and more. Further down you’ll see a list of all the Key user actions that meet your filter criteria, along with the Top 100 user actions (this list is initially based on total time consumed, but you can also filter based on JavaScript errors, action count, or duration.
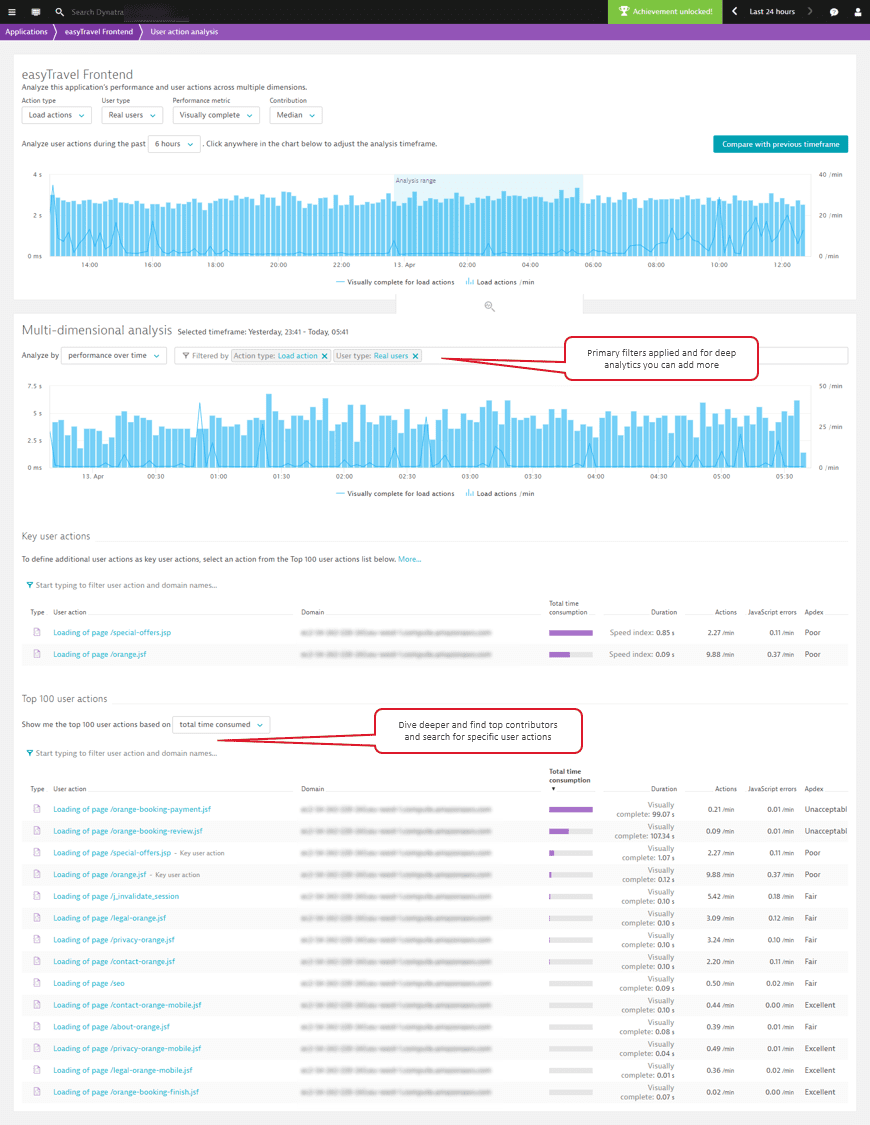


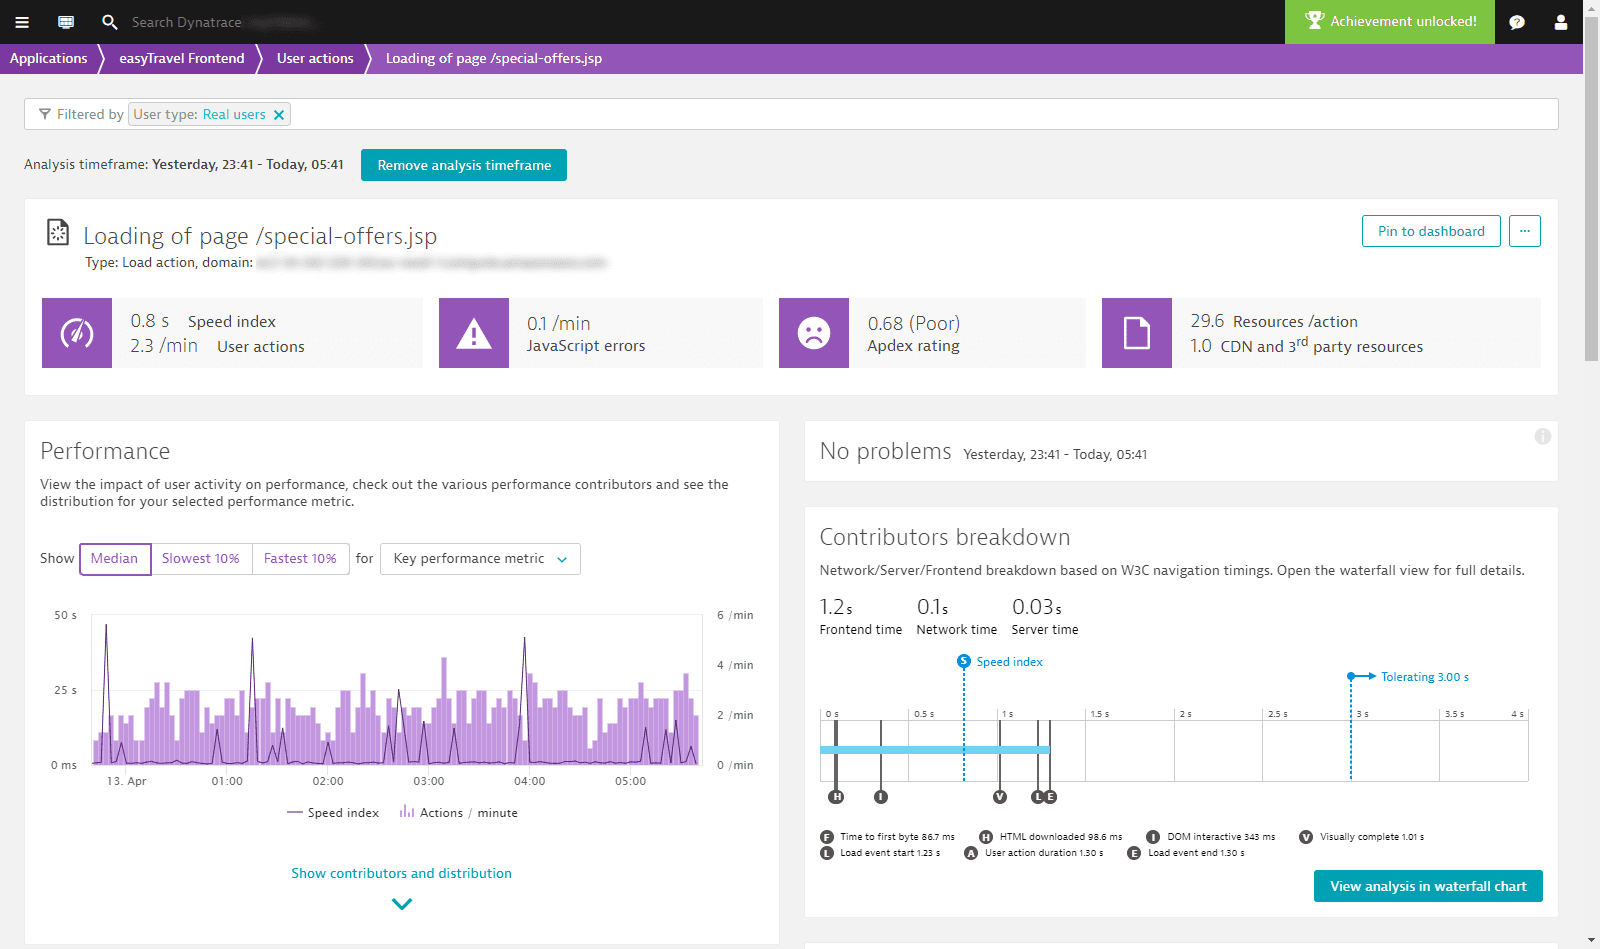
- Select the user action you want to investigate more deeply. This takes you to the User actions view of the selected user action (Loading of page
/special-offers.jspin the example below). As you can see, the defined filters and analysis time frame are applied to the analysis on this page.

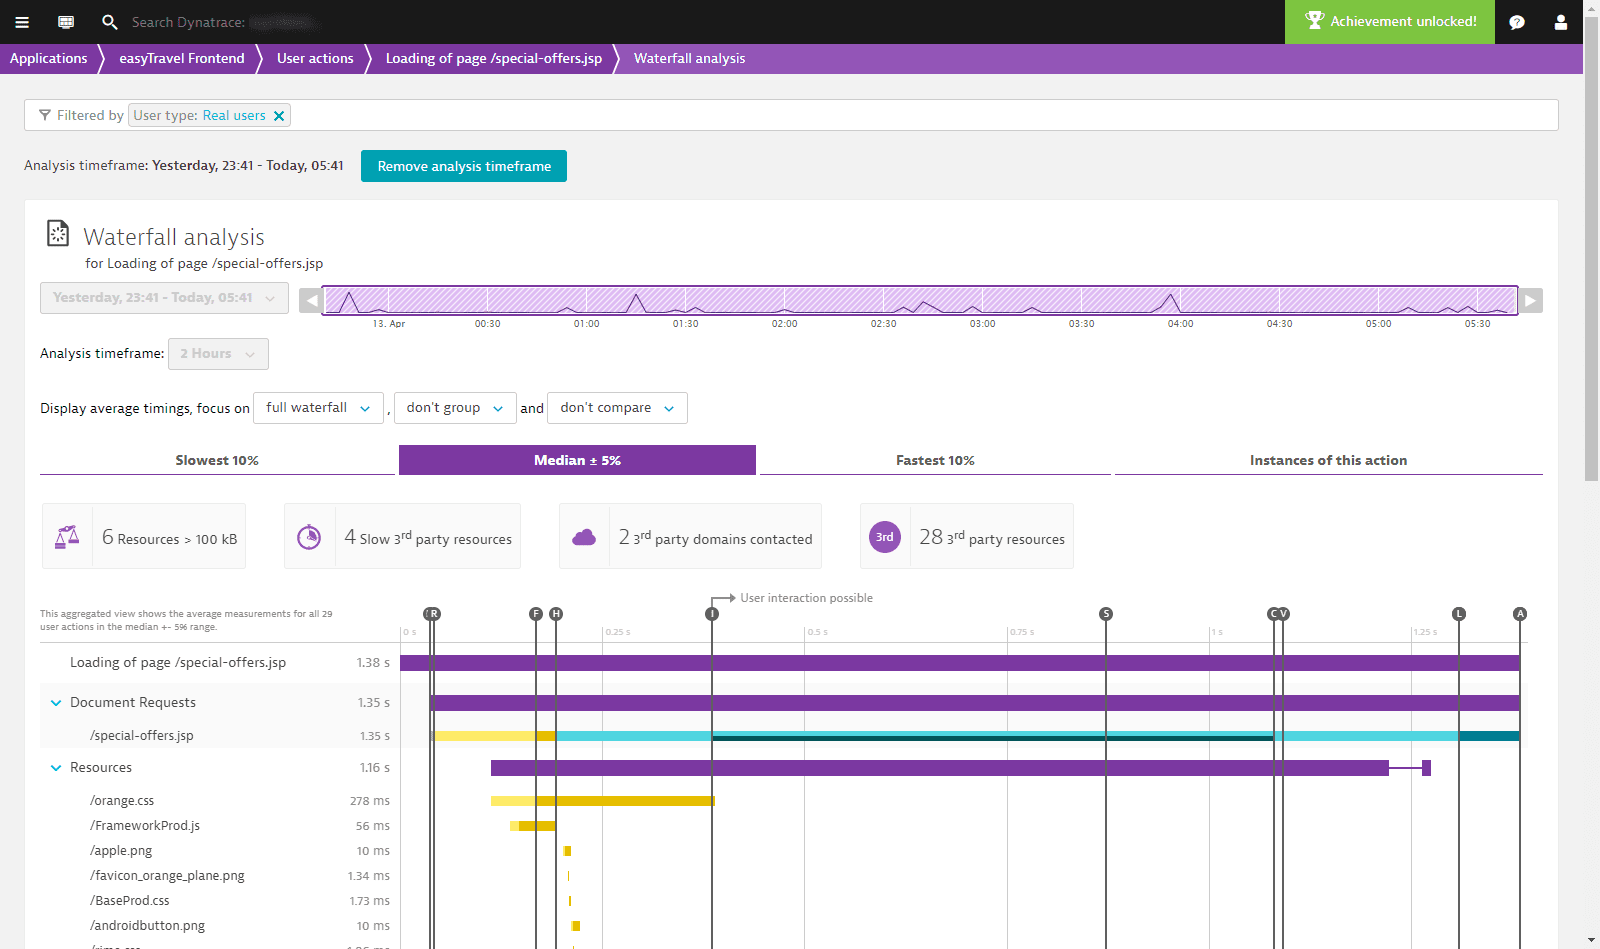
 The applied filters and analysis timeframe are even carried over to the Waterfall analysis view (see below).


