Dynatrace
DynaTrace, previously known as Compuware APM, is touted as the first self-learning Application Performance Monitoring Software. Through its agent is provides auto-discovered topology visualizations of applications and their components. This sets DynaTrace apart as an application performance tool. However, the one thing to keep in mind is that it takes time to learn. You may have to wait for enough data points to come in before you stop seeing false positives.
- Languages: .NET, Java
- SaaS or On-premise
- Visualizes application topology, deployments and environment changes in real-time.
- Performance issues in web-scale applications discovered with artificial intelligence.
- Auto-discovers all application components and dependencies end-to-end.
- Entire application topology is visualized in an interactive infographic.
- Dynatrace automatic baselining learns, how your application works.
Cost: $216 per month per server for SaaS version
Monitoring Components – Dynatrace
Synthetic Monitoring
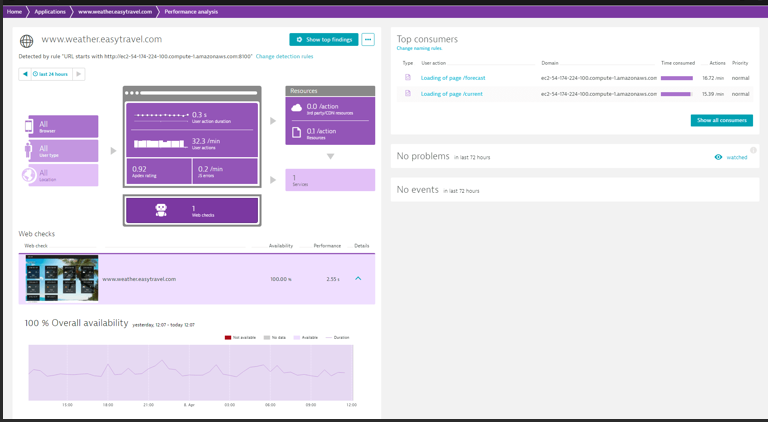
Dynatrace Synthetic Monitoring makes it easy for you to monitor the availability and performance of your applications as experienced by your customers around the world and around the clock. Availability is the success rate at a given instant or time period that indicates if your application is fully functional and available to users. Performance measures whether your web page or recorded interaction experiences significant slowdowns compared to a threshold.
Availability and performance of your internal resources is equally important. With monitors executed from a private location, you can bring the testing capabilities available in public locations right into your own environment.
Dynatrace offers three types of synthetic monitoring: single-URL browser monitors, browser clickpaths, and HTTP monitors.


Transactions and services
Web applications consist of web pages that are served by web servers and web containers, for example Tomcat. Web and mobile applications are built upon services that process requests like web requests, web service calls, and messaging. Such “server-side services” can take the form of web services, web containers, database requests, custom services, and more. Services may in turn call other services such as web services, remote services, and databases services.
Processes are essentially containers that host services. When you look at processes, you’re seeing topology information. Whereas services give you code-level insight. For example, you might have a Tomcat process that hosts a web application in the form of a server-side service. While processes are host-centric, associated with a single machine in your environment, services are request-centric and therefore typically span across multiple machines in a data center.


Log Monitoring
With Dynatrace Log Monitoring, you gain direct access to the log content of all your system’s mission-critical processes. It’s easy to search for specific log messages that you’re interested in. Log content can be filtered based on keywords or timeframe. You can even analyze multiple log files simultaneously—even when log files are stored across multiple hosts.
Most significantly, Dynatrace artificial intelligence automatically correlates relevant log messages with any problems that it detects in your environment. Relevant log messages that are associated with problems are then factored into problem root-cause analysis.
To enable Dynatrace Log Monitoring, just make sure that you’re running the latest version of Dynatrace. All new log content from important processes will then be auto-detected and monitored. There’s no need to copy or export log content to external storage to facilitate analysis.


Networks
Dynatrace infrastructure monitoring offers more than visibility into hosts and processes. With network communication monitoring, Dynatrace also gives you insight into the quality of the communications between your hosts and the processes that run on them. It isn’t enough to know that a process has sufficient server resources and responds in a timely manner. You also need assurance that your processes are clearly communicating their responses to calling parties and have uninterrupted access to all required resources. You also need to know which processes are consuming your network resources. Such network communication insight can be gained by monitoring the data packets that are exchanged between processes and the hosts they run on.


