Dynatrace
Dynatrace – Diagnostics
Apart from the automated problem detection, Dynatrace offers you a set of analysis tools that you can use to manually detect problems. CPU analysis highlights the biggest CPU consumers in your environment and allows you to drill down to the method level (Java or .NET) of a CPU problem. It also offers Memory analysis and Process crashes, tools that enable you to detect application crashes on Windows and Linux and analyze the core dumps of these crashes. For easier access, all these analysis views have been consolidated and displayed on the Diagnostics page.
CPU analysis
Crash analysis
Exception analysis
Memory dump analysis
Top database statements
Top web requests
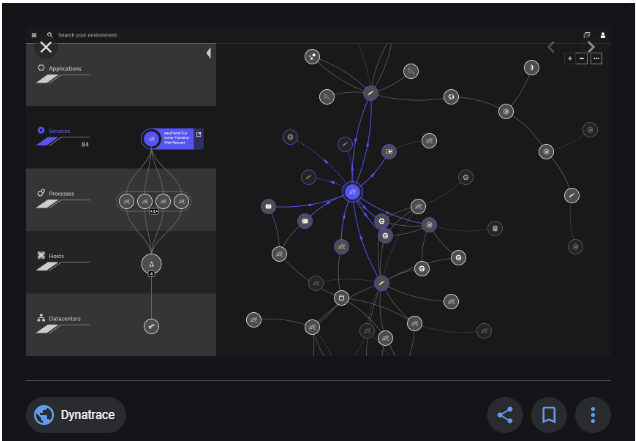
Smartscape
Smartscape, our near real-time environment-topology visualization tool, is one of the most powerful features of Dynatrace.
Smartscape auto-discovery delivers a quick and efficient visualization of all the topological dependencies in your infrastructure, processes, and services:
- On the vertical axis, it displays full-stack dependencies across all tiers
- On the horizontal axis, it visualizes all ingoing and outgoing call relationships within each tier
With just a few clicks, Smartscape gives you access to a detailed topological view of your entire environment, giving you more insight into and control over your environment.
- Make better decisions, such as adjusting your service architecture or infrastructure to improve application performance.
- Examine cross-tier and same-tier process, host, and service interdependencies to better understand how dependencies affect the performance of your applications.
- Drill down to gain clearer insight into problems. For example, Dynatrace might identify an issue with third-party dependencies and help you understand the impact of the issue on your application’s performance.


