AppDynamics RUM (Real User Monitoring)
Along with server side monitoring, AppDynamics also provides End User monitoring (RUM). With AppDynamics Pro you get in-depth performance metrics to evaluate the scalability and performance of your application. Use the AppDynamics Pro Metrics Browser to track end user experience times and errors over the duration of the load tests:


With AppDynamics End User Experience(RUM) Dashboard you get visibility into both the server-side and the client-side:


Use AppDynamics RUM to compare multiple application releases to see the change in performance and stability:


Browser Real User Monitoring components – AppDynamics RUM (Real User Monitoring)
By using browser real user monitoring follow end users journey and optimize their experience with powerful end-to-end performance management that rapidly identifies application issues and relevant business transactions, and dramatically reduces MTTR.
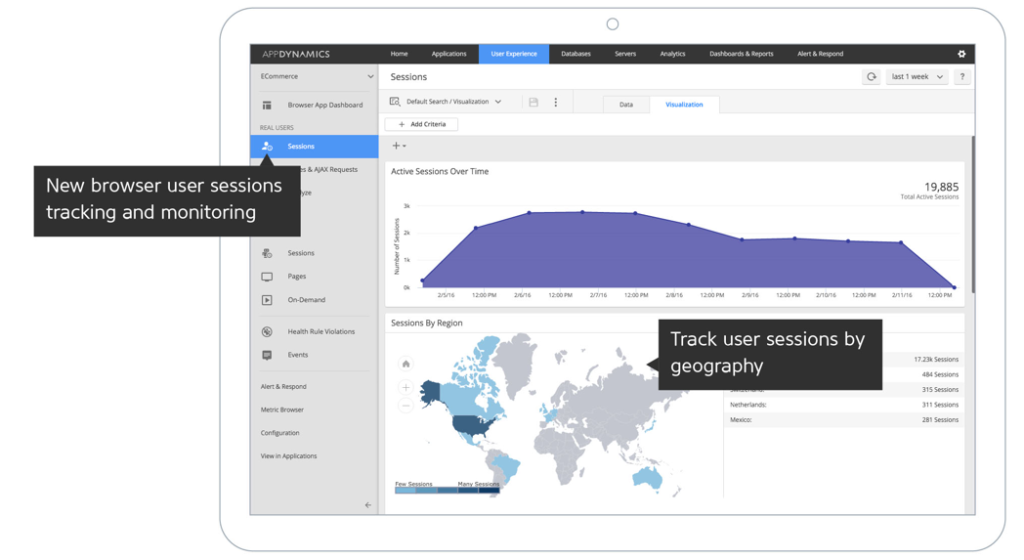


Understand end user experiences across the globe, in real-time
- Visually monitor your users’ customer journey and experience across the globe through a single pane of glass
- Instantly understand the regional variability on your website or single page application (SPA) experience
- See top page/SPA view requests and pages/SPA views with longest response times to focus on key issues
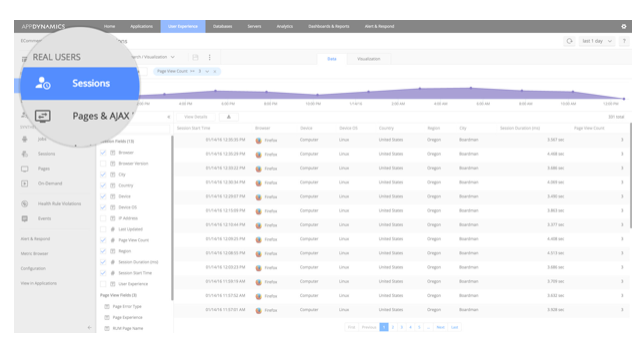


Quickly resolve web performance bottlenecks with end-to-end visibility – AppDynamics RUM (Real User Monitoring)
- Together with AppDynamics APM, automatically discover business transactions to monitor browser to back-end dependencies
- See all the business transactions involved through the customer journey for each browser real-user session
- Rapidly identifying any poorly performing line of code, from the web app to the database, leveraging Transaction Tag and Follow to improve collaboration between web developers, Web Ops, and the IT Ops teams


