Thread Dump & Analysis
A web server uses tens to hundreds of threads to process a large number of concurrent users. If two or more threads utilize the same resources, a contention between the threads is inevitable, and sometimes deadlock occurs and this is one of the main situation where we need to take the thread dump for finding the root cause.
Thread contention is a status in which one thread is waiting for a lock, held by another thread, to be lifted. Different threads frequently access shared resources on a web application. For example, to record a log, the thread trying to record the log must obtain a lock and access the shared resources.
Deadlock is a special type of thread contention, in which two or more threads are waiting for the other threads to complete their tasks in order to complete their own tasks.
Different issues can arise from thread contention. To analyze such issues, you need to use the thread dump. A thread dump will give you the information on the exact status of each thread.
Background Information for Java Threads
Thread Synchronization
A thread can be processed with other threads at the same time. In order to ensure compatibility when multiple threads are trying to use shared resources, one thread at a time should be allowed to access the shared resources by using thread synchronization.
Thread synchronization on Java can be done using monitor. Every Java object has a single monitor. The monitor can be owned by only one thread. For a thread to own a monitor that is owned by a different thread, it needs to wait in the wait queue until the other thread releases its monitor.
Thread Status
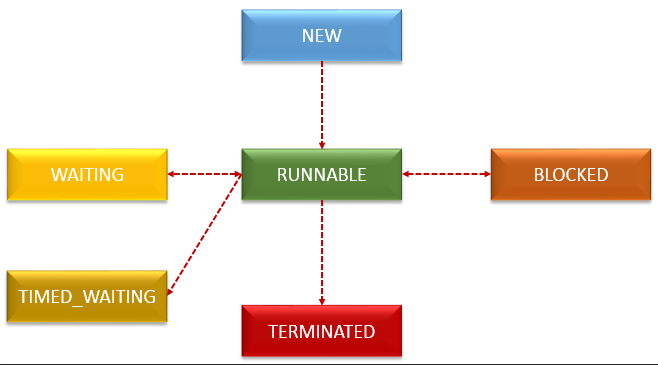
In order to analyze a thread dump, you need to know the status of threads. The statuses of threads are stated on java.lang.Thread.State.
- NEW: The thread is created but has not been processed yet.
- RUNNABLE: The thread is occupying the CPU and processing a task. (It may be in WAITING status due to the OS’s resource distribution.)
- BLOCKED: The thread is waiting for a different thread to release its lock in order to get the monitor lock.
- WAITING: The thread is waiting by using a wait, join or park method.
- TIMED_WAITING: The thread is waiting by using a sleep, wait, join or park method. (The difference from WAITING is that the maximum waiting time is specified by the method parameter, and WAITING can be relieved by time as well as external changes.)


Thread Types
Java threads can be divided into two:
- daemon threads;
- and non-daemon threads.
Daemon threads stop working when there are no other non-daemon threads. Even if you do not create any threads, the Java application will create several threads by default. Most of them are daemon threads, mainly for processing tasks such as garbage collection or JMX.
A thread running the ‘static void main(String[] args)’ method is created as a non-daemon thread, and when this thread stops working, all other daemon threads will stop as well. (The thread running this main method is called the VM thread in HotSpot VM.)
Getting a Thread Dump
We will introduce the three most commonly used methods. Note that there are many other ways to get a thread dump. A thread dump can only show the thread status at the time of measurement, so in order to see the change in thread status, it is recommended to extract them from 5 to 10 times with 5-second intervals.
Getting a Thread Dump Using jstack
In JDK 1.6 and higher, it is possible to get a thread dump on MS Windows using jstack.
Use PID via jps to check the PID of the currently running Java application process.
[user@linux ~]$ jps -v
25780 RemoteTestRunner -Dfile.encoding=UTF-8
25590 sub.rmi.registry.RegistryImpl 2999 -Dapplication.home=/home1/user/java/jdk.1.6.0_24 -Xms8m
26300 sun.tools.jps.Jps -mlvV -Dapplication.home=/home1/user/java/jdk.1.6.0_24 -Xms8m
Use the extracted PID as the parameter of jstack to obtain a thread dump.
[user@linux ~]$ jstack -f 5824
A Thread Dump Using jVisualVM
Generate a thread dump by using a program such as jVisualVM.
The task on the left indicates the list of currently running processes. Click on the process for which you want the information, and select the thread tab to check the thread information in real time. Click the Thread Dump button on the top right corner to get the thread dump file.
Generating in a Linux Terminal
Obtain the process pid by using ps -ef command to check the pid of the currently running Java process.
[user@linux ~]$ ps - ef | grep java
user 2477 1 0 Dec23 ? 00:10:45 ...
user 25780 25361 0 15:02 pts/3 00:00:02 ./jstatd -J -Djava.security.policy=jstatd.all.policy -p 2999
user 26335 25361 0 15:49 pts/3 00:00:00 grep java
Use the extracted pid as the parameter of kill –SIGQUIT(3) to obtain a thread dump.
Thread Information from the Thread Dump File
"pool-1-thread-13" prio=6 tid=0x000000000729a000 nid=0x2fb4 runnable [0x0000000007f0f000] java.lang.Thread.State: RUNNABLE
at java.net.SocketInputStream.socketRead0(Native Method)
at java.net.SocketInputStream.read(SocketInputStream.java:129)
at sun.nio.cs.StreamDecoder.readBytes(StreamDecoder.java:264)
at sun.nio.cs.StreamDecoder.implRead(StreamDecoder.java:306)
at sun.nio.cs.StreamDecoder.read(StreamDecoder.java:158)
- locked <0x0000000780b7e688> (a java.io.InputStreamReader)
at java.io.InputStreamReader.read(InputStreamReader.java:167)
at java.io.BufferedReader.fill(BufferedReader.java:136)
at java.io.BufferedReader.readLine(BufferedReader.java:299)
- locked <0x0000000780b7e688> (a java.io.InputStreamReader)
at java.io.BufferedReader.readLine(BufferedReader.java:362)
)
- Thread name: When using Java.lang.Thread class to generate a thread, the thread will be named Thread-(Number), whereas when using java.util.concurrent.ThreadFactory class, it will be named pool-(number)-thread-(number).
- Priority: Represents the priority of the threads.
- Thread ID: Represents the unique ID for the threads. (Some useful information, including the CPU usage or memory usage of the thread, can be obtained by using thread ID.)
- Thread status: Represents the status of the threads.
- Thread callstack: Represents the call stack information of the threads.
Thread Dump Patterns by Type
When Unable to Obtain a Lock (BLOCKED)
This is when the overall performance of the application slows down because a thread is occupying the lock and prevents other threads from obtaining it. In the following example, BLOCKED_TEST pool-1-thread-1 thread is running with <0x0000000780a000b0> lock, while BLOCKED_TEST pool-1-thread-2 and BLOCKED_TEST pool-1-thread-3 threads are waiting to obtain <0x0000000780a000b0> lock.
"BLOCKED_TEST pool-1-thread-1" prio=6 tid=0x0000000006904800 nid=0x28f4 runnable [0x000000000785f000]
java.lang.Thread.State: RUNNABLE
at java.io.FileOutputStream.writeBytes(Native Method)
at java.io.FileOutputStream.write(FileOutputStream.java:282)
at java.io.BufferedOutputStream.flushBuffer(BufferedOutputStream.java:65)
at java.io.BufferedOutputStream.flush(BufferedOutputStream.java:123)
- locked <0x0000000780a31778> (a java.io.BufferedOutputStream)
at java.io.PrintStream.write(PrintStream.java:432)
- locked <0x0000000780a04118> (a java.io.PrintStream)
at sun.nio.cs.StreamEncoder.writeBytes(StreamEncoder.java:202)
at sun.nio.cs.StreamEncoder.implFlushBuffer(StreamEncoder.java:272)
at sun.nio.cs.StreamEncoder.flushBuffer(StreamEncoder.java:85)
- locked <0x0000000780a040c0> (a java.io.OutputStreamWriter)
at java.io.OutputStreamWriter.flushBuffer(OutputStreamWriter.java:168)
at java.io.PrintStream.newLine(PrintStream.java:496)
- locked <0x0000000780a04118> (a java.io.PrintStream)
at java.io.PrintStream.println(PrintStream.java:687)
- locked <0x0000000780a04118> (a java.io.PrintStream)
at com.nbp.theplatform.threaddump.ThreadBlockedState.monitorLock(ThreadBlockedState.java:44)
- locked <0x0000000780a000b0> (a com.nbp.theplatform.threaddump.ThreadBlockedState)
at com.nbp.theplatform.threaddump.ThreadBlockedState$1.run(ThreadBlockedState.java:7)
at java.util.concurrent.ThreadPoolExecutor$Worker.runTask(ThreadPoolExecutor.java:886)
at java.util.concurrent.ThreadPoolExecutor$Worker.run(ThreadPoolExecutor.java:908)
at java.lang.Thread.run(Thread.java:662)
Locked ownable synchronizers:
- <0x0000000780a31758> (a java.util.concurrent.locks.ReentrantLock$NonfairSync)
"BLOCKED_TEST pool-1-thread-2" prio=6 tid=0x0000000007673800 nid=0x260c waiting for monitor entry [0x0000000008abf000]
java.lang.Thread.State: BLOCKED (on object monitor)
at com.nbp.theplatform.threaddump.ThreadBlockedState.monitorLock(ThreadBlockedState.java:43)
- waiting to lock <0x0000000780a000b0> (a com.nbp.theplatform.threaddump.ThreadBlockedState)
at com.nbp.theplatform.threaddump.ThreadBlockedState$2.run(ThreadBlockedState.java:26)
at java.util.concurrent.ThreadPoolExecutor$Worker.runTask(ThreadPoolExecutor.java:886)
at java.util.concurrent.ThreadPoolExecutor$Worker.run(ThreadPoolExecutor.java:908)
at java.lang.Thread.run(Thread.java:662)
Locked ownable synchronizers:
- <0x0000000780b0c6a0> (a java.util.concurrent.locks.ReentrantLock$NonfairSync)
"BLOCKED_TEST pool-1-thread-3" prio=6 tid=0x00000000074f5800 nid=0x1994 waiting for monitor entry [0x0000000008bbf000]
java.lang.Thread.State: BLOCKED (on object monitor)
at com.nbp.theplatform.threaddump.ThreadBlockedState.monitorLock(ThreadBlockedState.java:42)
- waiting to lock <0x0000000780a000b0> (a com.nbp.theplatform.threaddump.ThreadBlockedState)
at com.nbp.theplatform.threaddump.ThreadBlockedState$3.run(ThreadBlockedState.java:34)
at java.util.concurrent.ThreadPoolExecutor$Worker.runTask(ThreadPoolExecutor.java:886
at java.util.concurrent.ThreadPoolExecutor$Worker.run(ThreadPoolExecutor.java:908)
at java.lang.Thread.run(Thread.java:662)
Locked ownable synchronizers:
- <0x0000000780b0e1b8> (a java.util.concurrent.locks.ReentrantLock$NonfairSync)
When in Deadlock Status
This is when thread A needs to obtain thread B‘s lock to continue its task, while thread B needs to obtain thread A‘s lock to continue its task. In the thread dump, you can see that
DEADLOCK_TEST-1 thread has 0x00000007d58f5e48 lock, and is trying to obtain 0x00000007d58f5e60 lock.
You can also see that DEADLOCK_TEST-2 thread has 0x00000007d58f5e60 lock, and is trying to obtain 0x00000007d58f5e78 lock.
Also, DEADLOCK_TEST-3 thread has 0x00000007d58f5e78 lock, and is trying to obtain 0x00000007d58f5e48 lock.
As you can see, each thread is waiting to obtain another thread’s lock, and this status will not change until one thread discards its lock.
"DEADLOCK_TEST-1" daemon prio=6 tid=0x000000000690f800 nid=0x1820 waiting for monitor entry [0x000000000805f000]
java.lang.Thread.State: BLOCKED (on object monitor)
at com.nbp.theplatform.threaddump.ThreadDeadLockState$DeadlockThread.goMonitorDeadlock(ThreadDeadLockState.java:197)
- waiting to lock <0x00000007d58f5e60> (a com.nbp.theplatform.threaddump.ThreadDeadLockState$Monitor)
at com.nbp.theplatform.threaddump.ThreadDeadLockState$DeadlockThread.monitorOurLock(ThreadDeadLockState.java:182)
- locked <0x00000007d58f5e48> (a com.nbp.theplatform.threaddump.ThreadDeadLockState$Monitor)
at com.nbp.theplatform.threaddump.ThreadDeadLockState$DeadlockThread.run(ThreadDeadLockState.java:135)
Locked ownable synchronizers:
- None
"DEADLOCK_TEST-2" daemon prio=6 tid=0x0000000006858800 nid=0x17b8 waiting for monitor entry [0x000000000815f000]
java.lang.Thread.State: BLOCKED (on object monitor)
at com.nbp.theplatform.threaddump.ThreadDeadLockState$DeadlockThread.goMonitorDeadlock(ThreadDeadLockState.java:197)
- waiting to lock <0x00000007d58f5e78> (a com.nbp.theplatform.threaddump.ThreadDeadLockState$Monitor)
at com.nbp.theplatform.threaddump.ThreadDeadLockState$DeadlockThread.monitorOurLock(ThreadDeadLockState.java:182)
- locked <0x00000007d58f5e60> (a com.nbp.theplatform.threaddump.ThreadDeadLockState$Monitor)
at com.nbp.theplatform.threaddump.ThreadDeadLockState$DeadlockThread.run(ThreadDeadLockState.java:135)
Locked ownable synchronizers:
- None
"DEADLOCK_TEST-3" daemon prio=6 tid=0x0000000006859000 nid=0x25dc waiting for monitor entry [0x000000000825f000]
java.lang.Thread.State: BLOCKED (on object monitor)
at com.nbp.theplatform.threaddump.ThreadDeadLockState$DeadlockThread.goMonitorDeadlock(ThreadDeadLockState.java:197)
- waiting to lock <0x00000007d58f5e48> (a com.nbp.theplatform.threaddump.ThreadDeadLockState$Monitor)
at com.nbp.theplatform.threaddump.ThreadDeadLockState$DeadlockThread.monitorOurLock(ThreadDeadLockState.java:182)
- locked <0x00000007d58f5e78> (a com.nbp.theplatform.threaddump.ThreadDeadLockState$Monitor)
at com.nbp.theplatform.threaddump.ThreadDeadLockState$DeadlockThread.run(ThreadDeadLockState.java:135)
Locked ownable synchronizers:
- None
When Continuously Waiting to Receive Messages from a Remote Server
The thread appears to be normal, since its state keeps showing as RUNNABLE. However, when you align the thread dumps chronologically, you can see that socketReadThread thread is waiting infinitely to read the socket.
"socketReadThread" prio=6 tid=0x0000000006a0d800 nid=0x1b40 runnable [0x00000000089ef000]
java.lang.Thread.State: RUNNABLE
at java.net.SocketInputStream.socketRead0(Native Method)
at java.net.SocketInputStream.read(SocketInputStream.java:129)
at sun.nio.cs.StreamDecoder.readBytes(StreamDecoder.java:264)
at sun.nio.cs.StreamDecoder.implRead(StreamDecoder.java:306)
at sun.nio.cs.StreamDecoder.read(StreamDecoder.java:158)
- locked <0x00000007d78a2230> (a java.io.InputStreamReader)
at sun.nio.cs.StreamDecoder.read0(StreamDecoder.java:107)
- locked <0x00000007d78a2230> (a java.io.InputStreamReader)
at sun.nio.cs.StreamDecoder.read(StreamDecoder.java:93)
at java.io.InputStreamReader.read(InputStreamReader.java:151)
at com.nbp.theplatform.threaddump.ThreadSocketReadState$1.run(ThreadSocketReadState.java:27)
at java.lang.Thread.run(Thread.java:662)
When Waiting
The thread is maintaining WAIT status. In the thread dump, IoWaitThread thread keeps waiting to receive a message from LinkedBlockingQueue. If there continues to be no message for LinkedBlockingQueue, then the thread status will not change.
"IoWaitThread" prio=6 tid=0x0000000007334800 nid=0x2b3c waiting on condition [0x000000000893f000]
java.lang.Thread.State: WAITING (parking)
at sun.misc.Unsafe.park(Native Method)
- parking to wait for <0x00000007d5c45850> (a java.util.concurrent.locks.AbstractQueuedSynchronizer$ConditionObject)
at java.util.concurrent.locks.LockSupport.park(LockSupport.java:156)
at java.util.concurrent.locks.AbstractQueuedSynchronizer$ConditionObject.await(AbstractQueuedSynchronizer.java:1987)
at java.util.concurrent.LinkedBlockingDeque.takeFirst(LinkedBlockingDeque.java:440)
at java.util.concurrent.LinkedBlockingDeque.take(LinkedBlockingDeque.java:629)
at com.nbp.theplatform.threaddump.ThreadIoWaitState$IoWaitHandler2.run(ThreadIoWaitState.java:89)
at java.lang.Thread.run(Thread.java:662)
When Thread Resources Cannot be Organized Normally
Unnecessary threads will pile up when thread resources cannot be organized normally. If this occurs, it is recommended to monitor the thread organization process or check the conditions for thread termination.
How to Solve Problems by Using Thread Dump
Example 1: When the CPU Usage is Abnormally High
1. Extract the thread that has the highest CPU usage.
[user@linux ~]$ ps -mo pid.lwp.stime.time.cpu -C java
PID LWP STIME TIME %CPU
10029 - Dec07 00:02:02 99.5
- 10039 Dec07 00:00:00 0.1
- 10040 Dec07 00:00:00 95.5
From the application, find out which thread is using the CPU the most.
Acquire the Light Weight Process (LWP) that uses the CPU the most and convert its unique number (10039) into a hexadecimal number (0x2737).
2. After acquiring the thread dump, check the thread’s action.
Extract the thread dump of an application with a PID of 10029, then find the thread with an nid of 0x2737.
"NioProcessor-2" prio=10 tid=0x0a8d2800 nid=0x2737 runnable [0x49aa5000]
java.lang.Thread.State: RUNNABLE
at sun.nio.ch.EPollArrayWrapper.epollWait(Native Method)
at sun.nio.ch.EPollArrayWrapper.poll(EPollArrayWrapper.java:210)
at sun.nio.ch.EPollSelectorImpl.doSelect(EPollSelectorImpl.java:65)
at sun.nio.ch.SelectorImpl.lockAndDoSelect(SelectorImpl.java:69)
- locked <0x74c52678> (a sun.nio.ch.Util$1)
- locked <0x74c52668> (a java.util.Collections$UnmodifiableSet)
- locked <0x74c501b0> (a sun.nio.ch.EPollSelectorImpl)
at sun.nio.ch.SelectorImpl.select(SelectorImpl.java:80)
at external.org.apache.mina.transport.socket.nio.NioProcessor.select(NioProcessor.java:65)
at external.org.apache.mina.common.AbstractPollingIoProcessor$Worker.run(AbstractPollingIoProcessor.java:708)
at external.org.apache.mina.util.NamePreservingRunnable.run(NamePreservingRunnable.java:51)
at java.util.concurrent.ThreadPoolExecutor$Worker.runTask(ThreadPoolExecutor.java:886)
at java.util.concurrent.ThreadPoolExecutor$Worker.run(ThreadPoolExecutor.java:908)
at java.lang.Thread.run(Thread.java:662)
Extract thread dumps several times every hour, and check the status change of the threads to determine the problem.
Example 2: When the Processing Performance is Abnormally Slow
After acquiring thread dumps several times, find the list of threads with BLOCKED status.
" DB-Processor-13" daemon prio=5 tid=0x003edf98 nid=0xca waiting for monitor entry [0x000000000825f000]
java.lang.Thread.State: BLOCKED (on object monitor)
at beans.ConnectionPool.getConnection(ConnectionPool.java:102)
- waiting to lock <0xe0375410> (a beans.ConnectionPool)
at beans.cus.ServiceCnt.getTodayCount(ServiceCnt.java:111)
at beans.cus.ServiceCnt.insertCount(ServiceCnt.java:43)
"DB-Processor-14" daemon prio=5 tid=0x003edf98 nid=0xca waiting for monitor entry [0x000000000825f020]
java.lang.Thread.State: BLOCKED (on object monitor)
at beans.ConnectionPool.getConnection(ConnectionPool.java:102)
- waiting to lock <0xe0375410> (a beans.ConnectionPool)
at beans.cus.ServiceCnt.getTodayCount(ServiceCnt.java:111)
at beans.cus.ServiceCnt.insertCount(ServiceCnt.java:43)
" DB-Processor-3" daemon prio=5 tid=0x00928248 nid=0x8b waiting for monitor entry [0x000000000825d080]
java.lang.Thread.State: RUNNABLE
at oracle.jdbc.driver.OracleConnection.isClosed(OracleConnection.java:570)
- waiting to lock <0xe03ba2e0> (a oracle.jdbc.driver.OracleConnection)
at beans.ConnectionPool.getConnection(ConnectionPool.java:112)
- locked <0xe0386580> (a java.util.Vector)
- locked <0xe0375410> (a beans.ConnectionPool)
at beans.cus.Cue_1700c.GetNationList(Cue_1700c.java:66)
at org.apache.jsp.cue_1700c_jsp._jspService(cue_1700c_jsp.java:120)
Acquire the list of threads with BLOCKED status after getting the thread dumps several times.
If the threads are BLOCKED, extract the threads related to the lock that the threads are trying to obtain.
Through the thread dump, you can confirm that the thread status stays BLOCKED because <0xe0375410> lock could not be obtained. This problem can be solved by analyzing stack trace from the thread currently holding the lock.
There are two reasons why the above pattern frequently appears in applications using DBMS. The first reason is inadequate configurations. Despite the fact that the threads are still working, they cannot show their best performance because the configurations for DBCP and the like are not adequate. If you extract thread dumps multiple times and compare them, you will often see that some of the threads that were BLOCKED previously are in a different state.
The second reason is the abnormal connection. When the connection with DBMS stays abnormal, the threads wait until the time is out. In this case, even after extracting the thread dumps several times and comparing them, you will see that the threads related to DBMS are still in a BLOCKED state. By adequately changing the values, such as the timeout value, you can shorten the time in which the problem occurs.
Obtaining More Detailed Information by Using MBean
You can obtain ThreadInfo objects using MBean. You can also obtain more information that would be difficult to acquire via thread dumps, by using ThreadInfo.
ThreadMXBean mxBean = ManagementFactory.getThreadMXBean();
long[] threadIds = mxBean.getAllThreadIds();
ThreadInfo[] threadInfos =
mxBean.getThreadInfo(threadIds);
for (ThreadInfo threadInfo : threadInfos) {System.out.println(
threadInfo.getThreadName());
System.out.println(
threadInfo.getBlockedCount());
System.out.println(
threadInfo.getBlockedTime());
System.out.println(
threadInfo.getWaitedCount());
System.out.println(
threadInfo.getWaitedTime());
}
You can acquire the amount of time that the threads WAITed or were BLOCKED by using the method in ThreadInfo, and by using this you can also obtain the list of threads that have been inactive for an abnormally long period of time.
