Lighthouse
Lighthouse is an open-source tool for running audits to improve web page quality. It’s integrated into Chrome’s DevTools and can be also installed as a Chrome extension or CLI-based tool. It’s an indispensable tool for measuring, debugging and improving the performance of modern, client-side apps (particularity PWAs).


How does Lighthouse works
Historically, web performance has been measured with the load event. However, even though load is a well-defined moment in a page’s lifecycle, that moment doesn’t necessarily correspond with anything the user cares about.
For example, a server could respond with a minimal page that “loads” immediately but then defers fetching content and displaying anything on the page until several seconds after the load event fires. While such a page might technically have a fast load time, that time would not correspond to how a user actually experiences the page loading.
Over the past few years, members of the Chrome team—in collaboration with the W3C Web Performance Working Group—have been working to standardize a set of new APIs and metrics that more accurately measure how users experience the performance of a web page.
To help ensure the metrics are relevant to users, we frame them around a few key questions:
| Is it happening? | Did the navigation start successfully? Has the server responded? |
| Is it useful? | Has enough content rendered that users can engage with it? |
| Is it usable? | Can users interact with the page, or is it busy? |
| Is it delightful? | Are the interactions smooth and natural, free of lag and junk? |
How metrics are measured in Lighthouse
Performance metrics are generally measured in one of two ways:
- In the lab: using tools to simulate a page load in a consistent, controlled environment
- In the field: on real users actually loading and interacting with the page
Neither of these options is necessarily better or worse than the other—in fact you generally want to use both to ensure good performance.
In the lab
Testing performance in the lab is essential when developing new features. Before features are released in production, it’s impossible to measure their performance characteristics on real users, so testing them in the lab before the feature is released is the best way to prevent performance regressions.
In the field
On the other hand, while testing in the lab is a reasonable proxy for performance, it isn’t necessarily reflective of how all users experience your site in the wild.
The performance of a site can vary dramatically based on a user’s device capabilities and their network conditions. It can also vary based on whether (or how) a user is interacting with the page.
Moreover, page loads may not be deterministic. For example, sites that load personalized content or ads may experience vastly different performance characteristics from user to user. A lab test will not capture those differences.
The only way to truly know how your site performs for your users is to actually measure its performance as those users are loading and interacting with it. This type of measurement is commonly referred to as Real User Monitoring—or RUM for short.
Types of metrics in Lighthouse
There are several other types of metrics that are relevant to how users perceive performance.
- Perceived load speed: how quickly a page can load and render all of its visual elements to the screen.
- Load responsiveness: how quickly a page can load and execute any required JavaScript code in order for components to respond quickly to user interaction
- Runtime responsiveness: after page load, how quickly can the page respond to user interaction.
- Visual stability: do elements on the page shift in ways that users don’t expect and potentially interfere with their interactions?
- Smoothness: do transitions and animations render at a consistent frame rate and flow fluidly from one state to the next?
Given all the above types of performance metrics, it’s hopefully clear that no single metric is sufficient to capture all the performance characteristics of a page.
Important metrics to measure
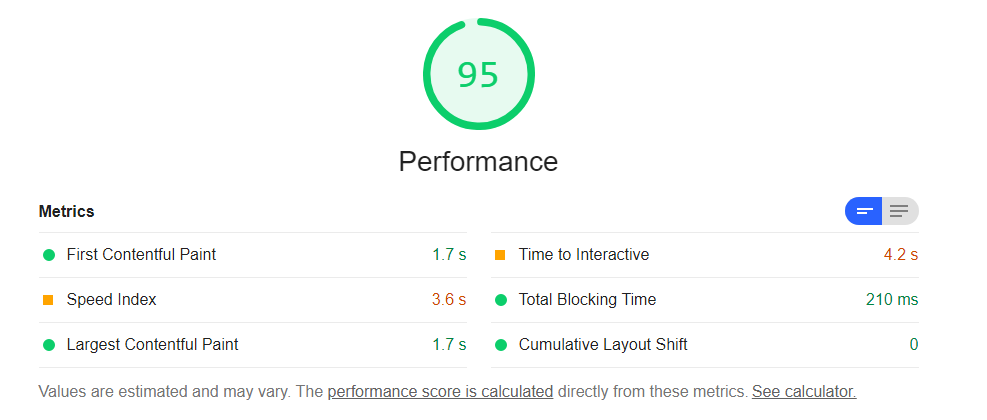
- First contentful paint (FCP): measures the time from when the page starts loading to when any part of the page’s content is rendered on the screen.
- Largest contentful paint (LCP): measures the time from when the page starts loading to when the largest text block or image element is rendered on the screen.
- First input delay (FID): measures the time from when a user first interacts with your site (i.e. when they click a link, tap a button, or use a custom, JavaScript-powered control) to the time when the browser is actually able to respond to that interaction.
- Time to Interactive (TTI): measures the time from when the page starts loading to when it’s visually rendered, its initial scripts (if any) have loaded, and it’s capable of reliably responding to user input quickly.
- Total blocking time (TBT): measures the total amount of time between FCP and TTI where the main thread was blocked for long enough to prevent input responsiveness.
- Cumulative layout shift (CLS): measures the cumulative score of all unexpected layout shifts that occur between when the page starts loading and when its lifecycle state changes to hidden.
While this list includes metrics measuring many of the various aspects of performance relevant to users, it does not include everything (e.g. runtime responsiveness and smoothness are not currently covered).
In some cases, new metrics will be introduced to cover missing areas, but in other cases the best metrics are ones specifically tailored to your site.
Pages: 1 2