AppDynamics
Correlate Business Transaction Logs – Appdynamics
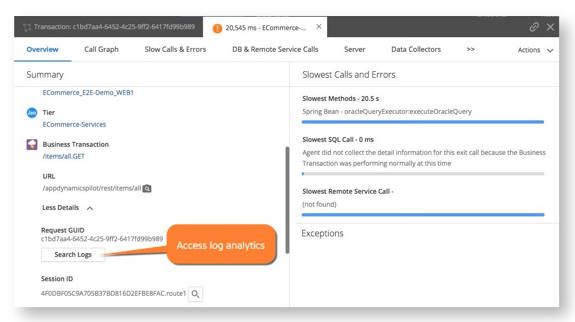
For those times when tracing application code doesn’t provide enough clues to track down the cause of a problem, AppDynamics provides visibility into the transaction logs that can be correlated to specific business transaction requests. Log correlation visibility requires a license for both Transaction Analytics and Log Analytics. See Business Transaction and Log Correlation


Transaction Snapshots
AppDynamics monitors every execution of a business transaction in the instrumented environment, and the metrics reflect all such executions. However, for troubleshooting purposes, AppDynamics takes snapshots of specific instances of a transaction. A transaction snapshot gives you a cross-tier view of the processing flow for a single invocation of a transaction.
Call drill-downs, where available, detail key information including slowest methods, errors, and remote service calls for the transaction execution on a tier. A drill-down may include a partial or complete call graph. Call graphs reflect the code-level view of the processing of the business transaction on a particular tier.
This topic covers how to view transaction snapshot data to monitor and troubleshoot business transaction performance. To learn more about when AppDynamics takes transaction snapshots or how to configure transaction snapshot settings, see Transaction Snapshot Collection.
View Transaction Snapshots
You can access business transaction snapshots from the following locations in the AppDynamics Controller:
- Troubleshooting > Slow Response Times or Troubleshooting > Errors left navigation tree for a business application
- Transaction Snapshots tab on the Business Transaction Dashboard
Double-click a business transaction snapshot to display the snapshot viewer. The following screen capture and its accompanying table identify the metrics available in the transaction flow map:
| Callout | Metric Name | Explanation |
|---|---|---|
| Callout | Metric Name | Explanation |
| 1 | Tier Response Time (ms) | The total response time for the call as measured at the calling tier. This includes the processing time on the called tier as well as on any tiers and backends it calls in turn. |
| 2 | Percentage of Time Spent (%) | The time spent downstream processing at all downstream tiers and backends as measured by the calling tier and represented as a percentage of the entire execution lifespan of a business transaction. This metric does not include the processing time of asynchronous activities, if any. |
| 3 | Asynchronous Activity Processing Time (ms) | The processing time of all asynchronous activities at this tier. This metric does not contribute to the overall tier response time because the activity is asynchronous by nature. This metric is calculated by adding the execution times of all asynchronous activities at a tier and the time spent in communication between other tiers and backends as follows:Asynchronous Activity Processing Time = Asynchronous-activity-1-processing-time + Asynchronous-activity-2-processing-time + so on.In the Metric Browser, you can view the Average Async Processing Time metric, which shows the average of the async activity processing time over the selected time range. |
| 4 | Execution Time (ms) | Total time spent processing by the business transaction in all affected tiers and communication with other tiers and backends. This metric does not include the processing time of the asynchronous activities. However, in the case of Wait-for-Completion, the originating business transaction will take longer to process the request due to blocking and waiting for all the activities to complete before proceeding.The formula for this metric is calculated by summing up the processing times of a Business Transaction at a particular Tier/communication between Tiers/Backends as follows:Execution Time = Time-spent-processing-in-Tier-1 + Time-spent-processing-in-Tier-2 + Time-spent-communicating-with-Tier-2 + so on. |
The Potential Issues panel highlights slow methods and slow remote service to help you investigate the root causes for performance issues. Click an item in the Potential Issues list to view the call in the call graph.
In the flow map for a business transaction snapshot, a tier with a Drill-Down link indicates AppDynamics has taken a call graph for that tier. To drill into a call graph for a correlated application in a transaction with cross-application flow, you need view permissions to the destination business application.
If you use the Java Agent and monitor Oracle databases with Database Monitoring and you have configured snapshot correlation between the Java Agent and the Database Agent, the flow map may also include database drill-downs.
The flow map or Overview is one of several views of the business transaction in the snapshot viewer. Other views include:
- Slow Calls and Errors, which presents information on the slowest database and remote service calls, slowest methods, and errors. You can gain further insight into these slow calls and errors either by viewing their details on by drilling down into their call graphs.
- Waterfall View, which shows the execution of an individual business transaction broken into execution segments. Each segment (shown as a blue bar) represents the time spent executing code on a particular thread within an instrumented application runtime, or the time spent waiting for responses from un-instrumented backends. Handoffs between segments are shown as solid lines for synchronous requests, and dotted for asynchronous requests. The waterfall view allows you to quickly determine which calls consumed the transaction time for a given snapshot. You can click on a segment to view the resource wait time for its business transaction. Additionally, you can review downstream applications indicated with the flow map icon.
- Segment List, which shows the various legs of the transaction in descending order of duration and give access to their snapshots and allows you to drill down into their details.
