AWR Key Metrics
This section contains detailed guidance for evaluating key sections of an AWR report. The data in an AWR report is the delta, or changes, between the accumulated metrics within each snapshot. Reading an AWR report id difficult because most of the metrics are undocumented because the AWR report was originally designed for Oracle support internal-use only.


The main sections in an AWR report, apart from regular CPU, Memory stats, includes:
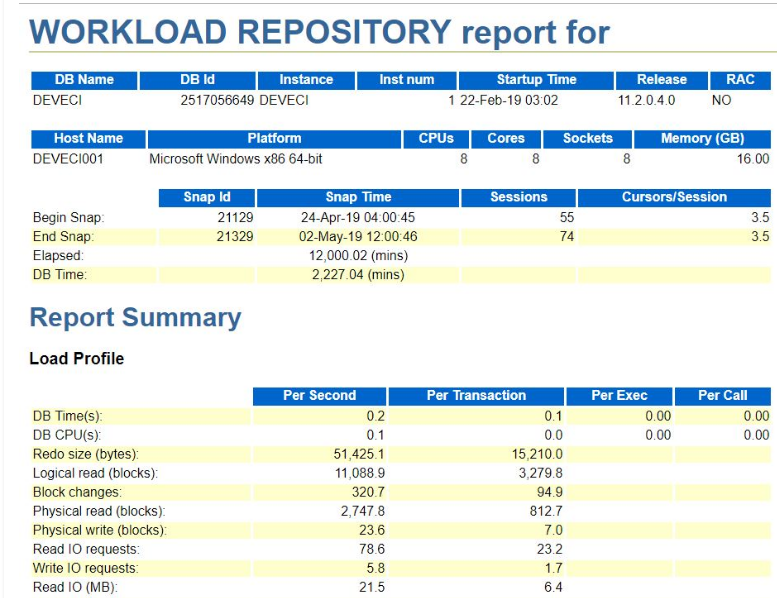
Report Summary: This gives an overall summary of the instance during the snapshot period, and it contains important aggregate summary information.
Cache Sizes (end): This shows the size of each SGA region after AMM has changed them. This information can be compared to the original init.ora parameters at the end of the AWR report.
Load Profile: This important section shows important rates expressed in units of per second and transactions per second.
Instance Efficiency Percentages: With a target of 100%, these are high-level ratios for activity in the SGA.
Shared Pool Statistics: This is a good summary of changes to the shared pool during the snapshot period.
Top 5 Timed Events: This is the most important section in the AWR report. It shows the top wait events and can quickly show the overall database bottleneck.
Wait Events Statistics Section: This section shows a breakdown of the main wait events in the database including foreground and background database wait events as well as time model, operating system, service, and wait classes statistics.
Wait Events: This AWR report section provides more detailed wait event information for foreground user processes which includes Top 5 wait events and many other wait events that occurred during the snapshot interval.
Background Wait Events: This section is relevant to the background process wait events.
Time Model Statistics: Time mode statistics report how database-processing time is spent. This section contains detailed timing information on particular components participating in database processing.
Operating System Statistics: The stress on the Oracle server is important, and this section shows the main external resources including I/O, CPU, memory, and network usage.
Service Statistics
The service statistics section gives information about how particular services configured in the database are operating.
- SQL Section: This section displays top SQL, ordered by important SQL execution metrics.
- SQL Ordered by Elapsed Time: Includes SQL statements that took significant execution time during processing.
- SQL Ordered by CPU Time: Includes SQL statements that consumed significant CPU time during its processing.
- SQL Ordered by Gets: These SQLs performed a high number of logical reads while retrieving data.
- SQL Ordered by Reads: These SQLs performed a high number of physical disk reads while retrieving data.
- SQL Ordered by Parse Calls: These SQLs experienced a high number of reparsing operations.
- SQL Ordered by Sharable Memory: Includes SQL statements cursors which consumed a large amount of SGA shared pool memory.
- SQL Ordered by Version Count: These SQLs have a large number of versions in shared pool for some reason.
- Instance Activity Stats: This section contains statistical information describing how the database operated during the snapshot period.
- Instance Activity Stats (Absolute Values): This section contains statistics that have absolute values not derived from end and start snapshots.
- Instance Activity Stats (Thread Activity): This report section reports a log switch activity statistic.
Pages: 1 2
