Heap Dump & Analysis
Heap Dump & Analysis
MAT – Memory Analyzer Tool
The Eclipse Memory Analyzer tool (MAT) is a fast and feature-rich heap dump analyzer that helps you find memory leaks and analyze high memory consumption issues.
With Memory Analyzer one can easily
- find the biggest objects, as MAT provides reasonable accumulated size (retained size)
- explore the object graph, both inbound and outbound references
- compute paths from the garbage collector roots to interesting objects
- find memory waste, like redundant String objects, empty collection objects, etc.
Overview – MAT
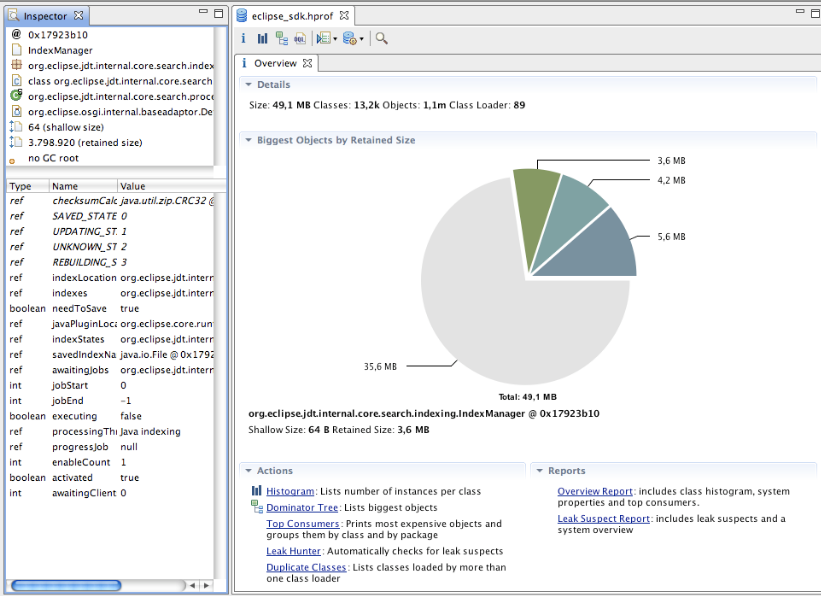
OverviewGet an overview of the heap dump: Size and total number of objects at the top, then a pie chart with the biggest objects and links to continue the analysis.
Histogram
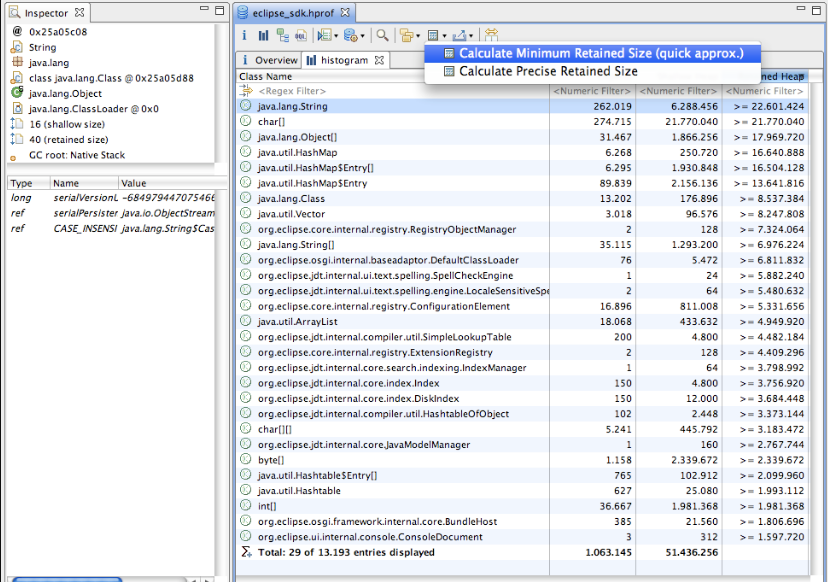
Histogram lists all the different classes loaded in your Java Application at the time of heap dump. It also lists the number of objects per class along with the shallow and retained heap size. Using the histogram, it is hard to identify which object is taking the most memory. However, we can easily identify which class type holds the largest amount of memory. For instance, in the screenshot below byte array holds the largest amount of memory. But, we cannot identify which object actually holds that byte array.
Shallow Heap v/s Retained Heap
Shallow Heap is the size of the object itself. For instance, in the screenshot below byte array itself holds the largest amount of memory. Retained Heap is the size of the object itself as well as the size of all the objects retained in it.
Dominator Tree
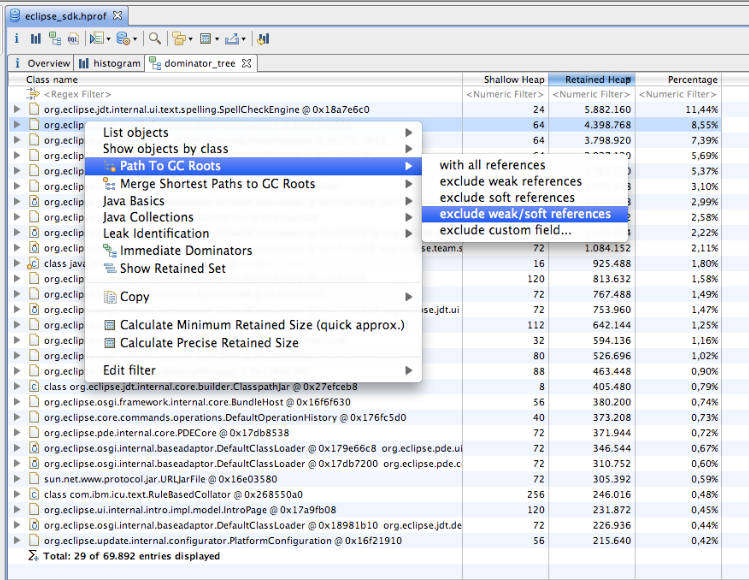
The Dominator Tree lists the biggest objects. One could call it a “Keep-Alive Tree” because the next level shows those objects which are immediately prevented from being garbage collected. Right-click to drill down: view the outgoing and incoming reference or view the path to the GC roots to see the reference chain which keeps the objects alive.
Path to GC Roots
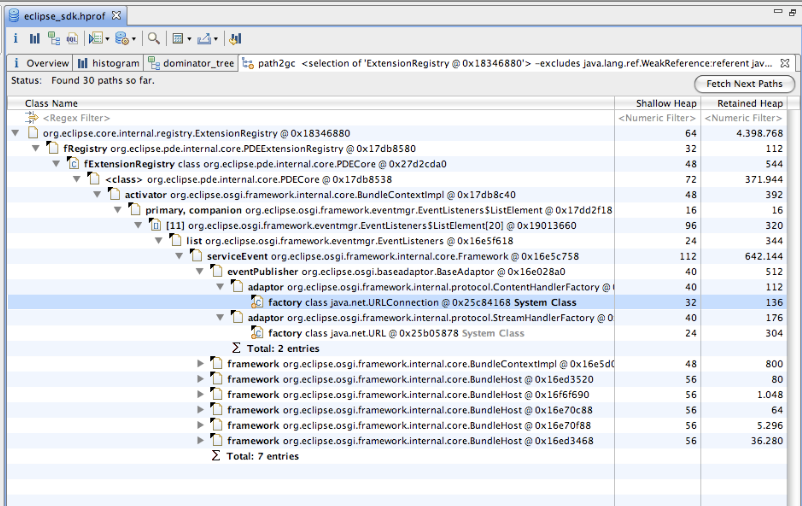
The path to the GC Roots shows the reference chain which prevents that the object is garbage collected. Objects decorated with a yellow dot are Garbage Collection (GC) Roots, i.e. objects which are assumed to be alive. Usually GC Roots are objects that are currently on the call stack of a thread or system classes.
Dominator Tree Grouped by Class Loader
Any decent architectures loads components by different class loaders. Many views of the Memory Analyzer allow you to group the objects by class loader and, hence, easily analyze memory by component. To map the class loader to a meaningful component name (for example the plug-in id), one can plug-in name resolver.

Duplicate Classes
The duplicate class tab will list down the classes that are loaded multiple times. If you are using ClassLoaders in your code you can use the Duplicate Classes to ensure that the code is functioning properly and classes are not loaded multiple times.
Leak Suspect
Finally, the Leak suspect report runs a leak suspect query that analyzes the Heap dump and tries to find the memory leak. For non-trivial memory leaks, the Leak suspect query may not be able to identify the memory leak and it’s up to the developer with the knowledge of the program to pinpoint the leak using the tools discussed above.
Pages: 1 2